ActivTrak is a workforce analytics and intelligence software-as-a-service (SaaS) platform that analyzes digital work activity data for insights to improve how people work – in office or remote.
- Gain a complete picture of work habits and potential blockers to success.
- View organization-wide productivity trends for agile decision making.
- Improve technology usage and workflows to optimize efficiencies.
- Share weekly work insights with managers and employees to guide progress and growth.
- Safeguard data privacy and security of customers and employees.

Editor’s Rating
Google Analytics for your officeActivTrak brings affordable pricing and an intuitive user interface while avoiding overbearing monitoring features. Instead, it offers employee productivity metrics and team behavior analytics. It’s like Google Analytics for your office.What you can do with ActivTrak
ActivTrak gives you the work intelligence to understand how work happens across people, tools and AI. Measure productivity, improve efficiency, and see how AI is changing workflows—so you can improve performance across your organization.
Executive Insights
Transform workforce data into boardroom-ready insights. See cross-team performance, identify hidden cost savings and make confident decisions that drive measurable business outcomes.
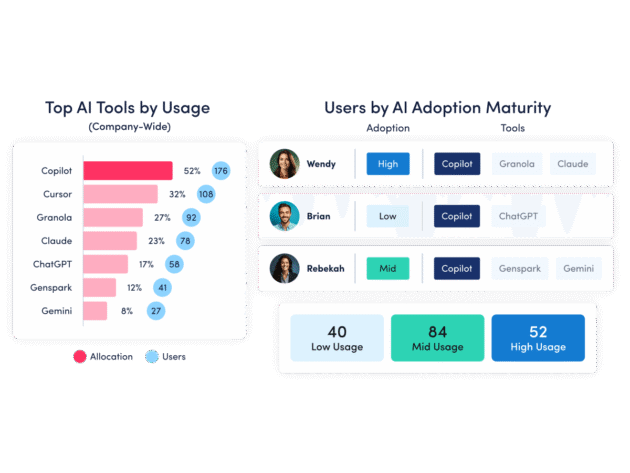
AI Insights
Understand how tools — and AI — are shaping work. See how applications and AI tools are used. Identify what’s driving value, where licenses are underused and how workflows are evolving.
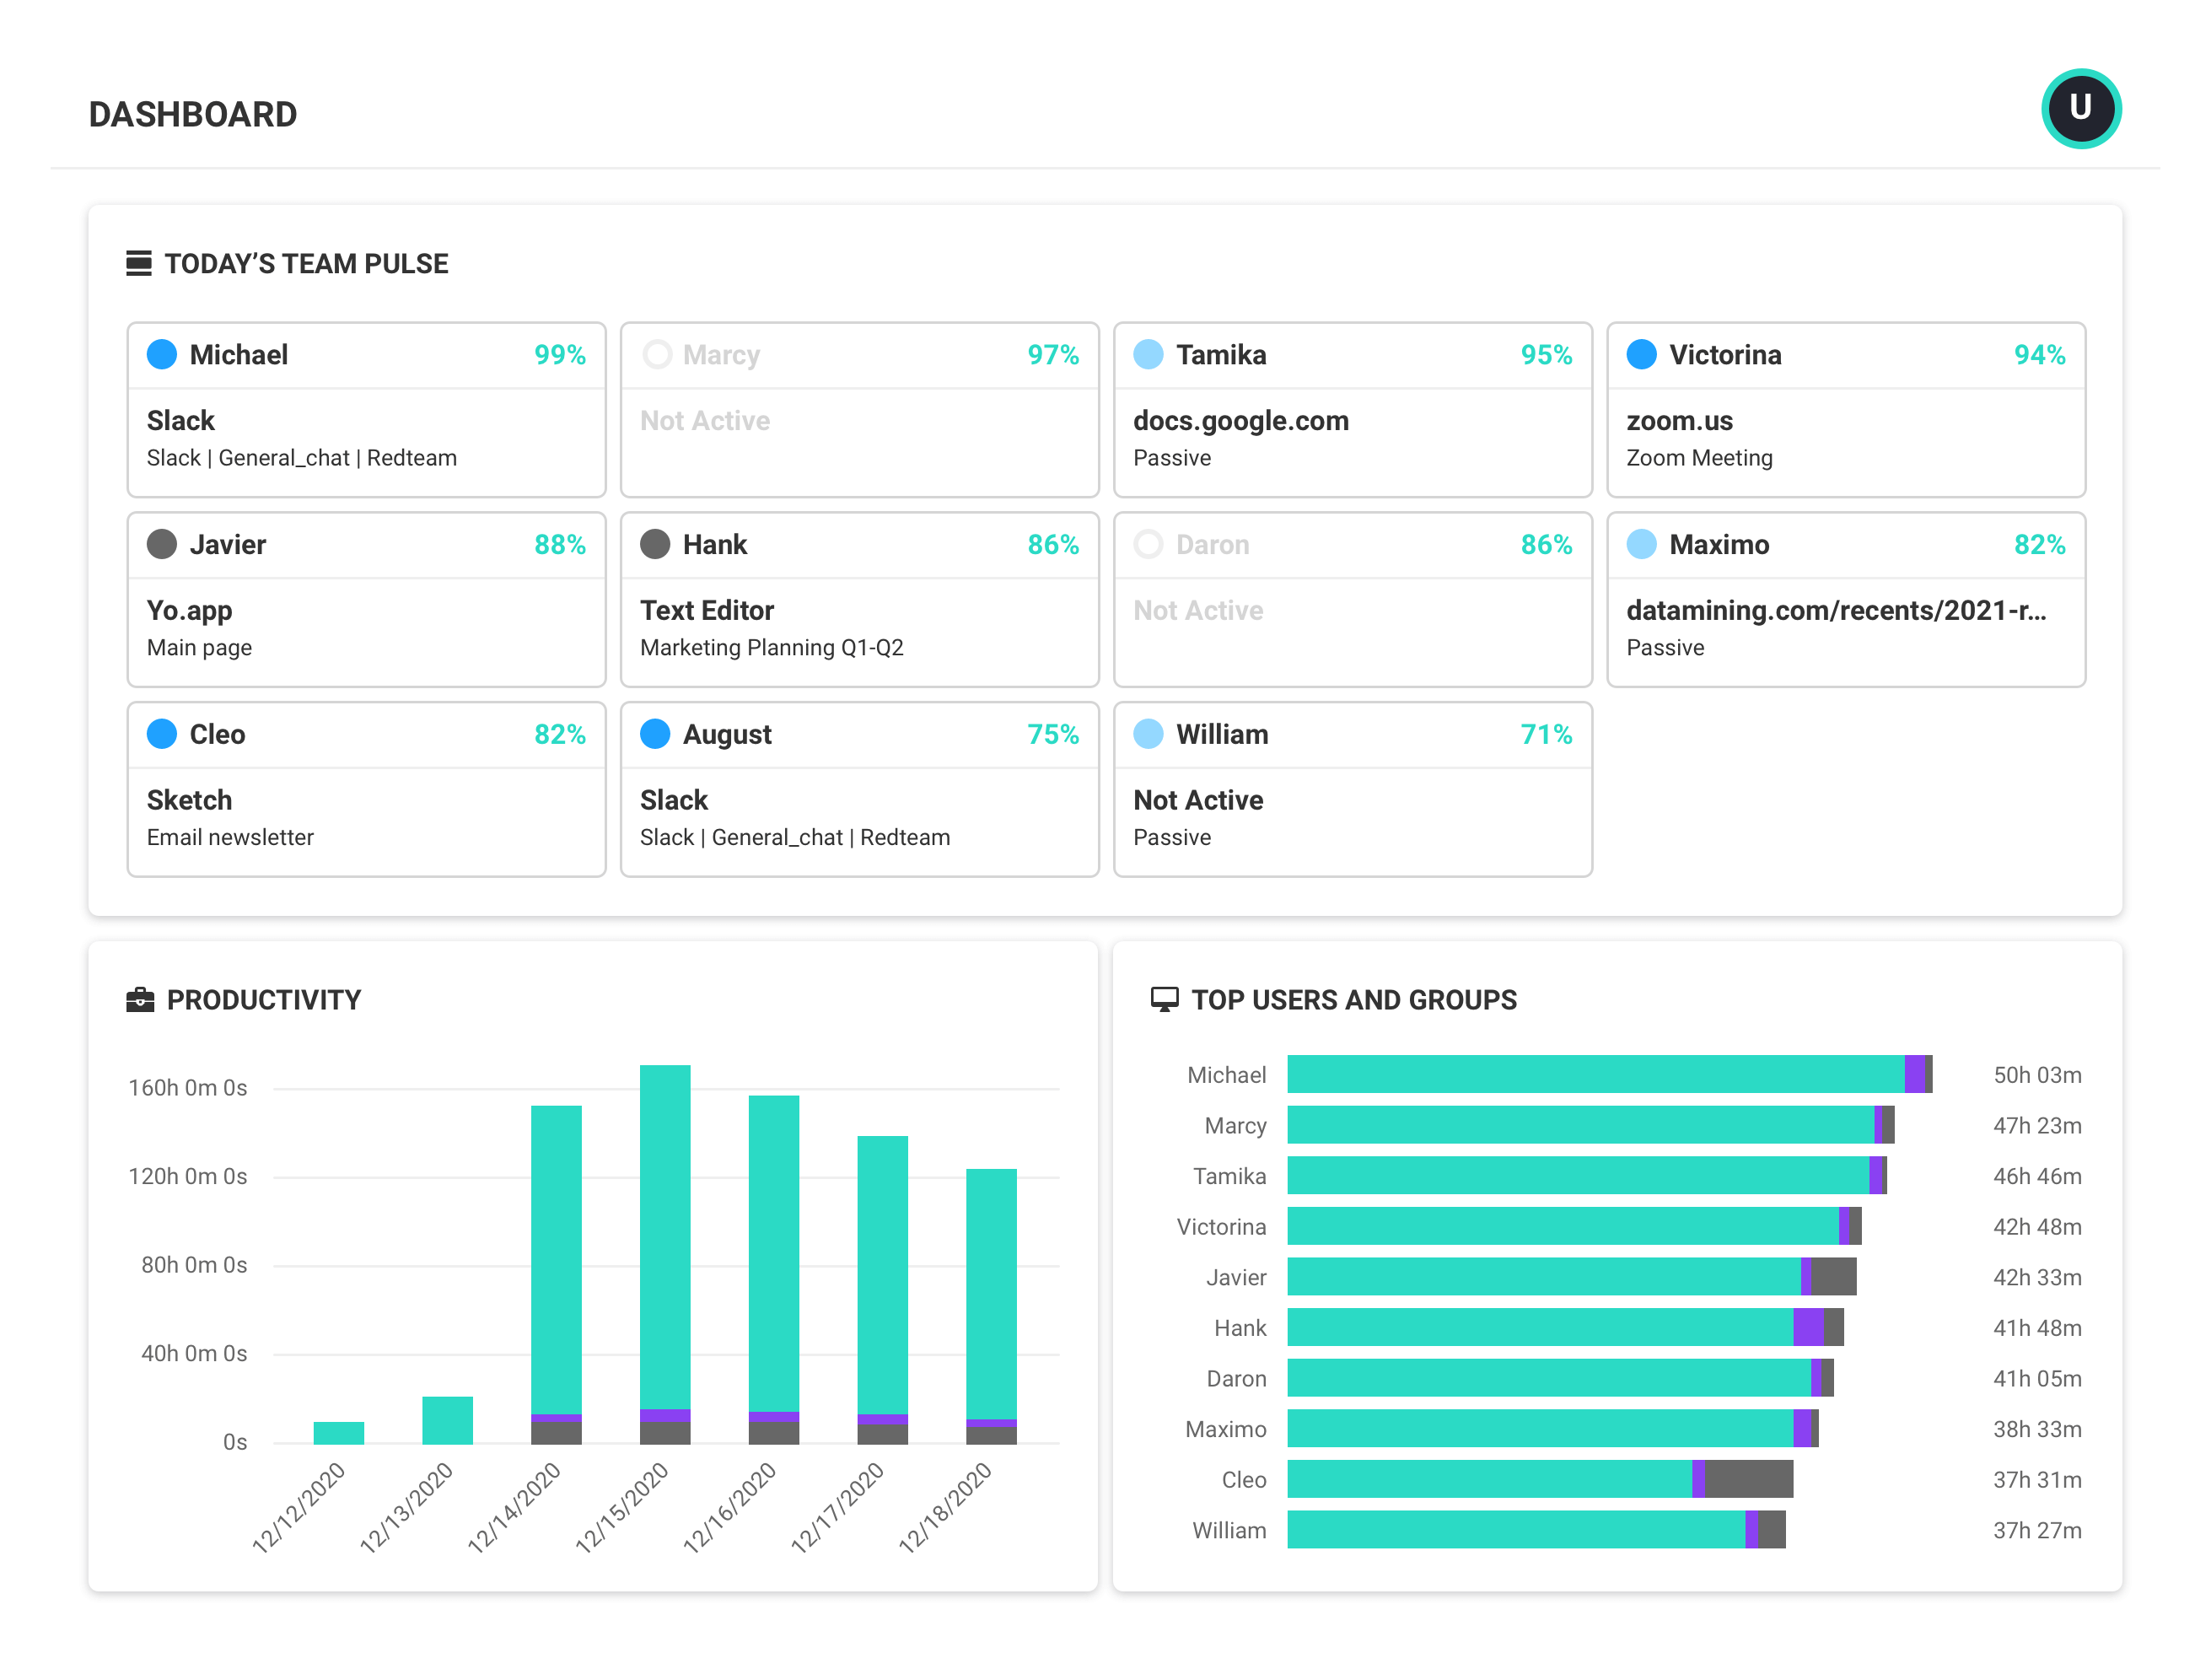
Workforce Management
Understand how work happens across your organization. Analyze work patterns across teams, roles and tools to see where time goes, where friction exists and where performance can improve.
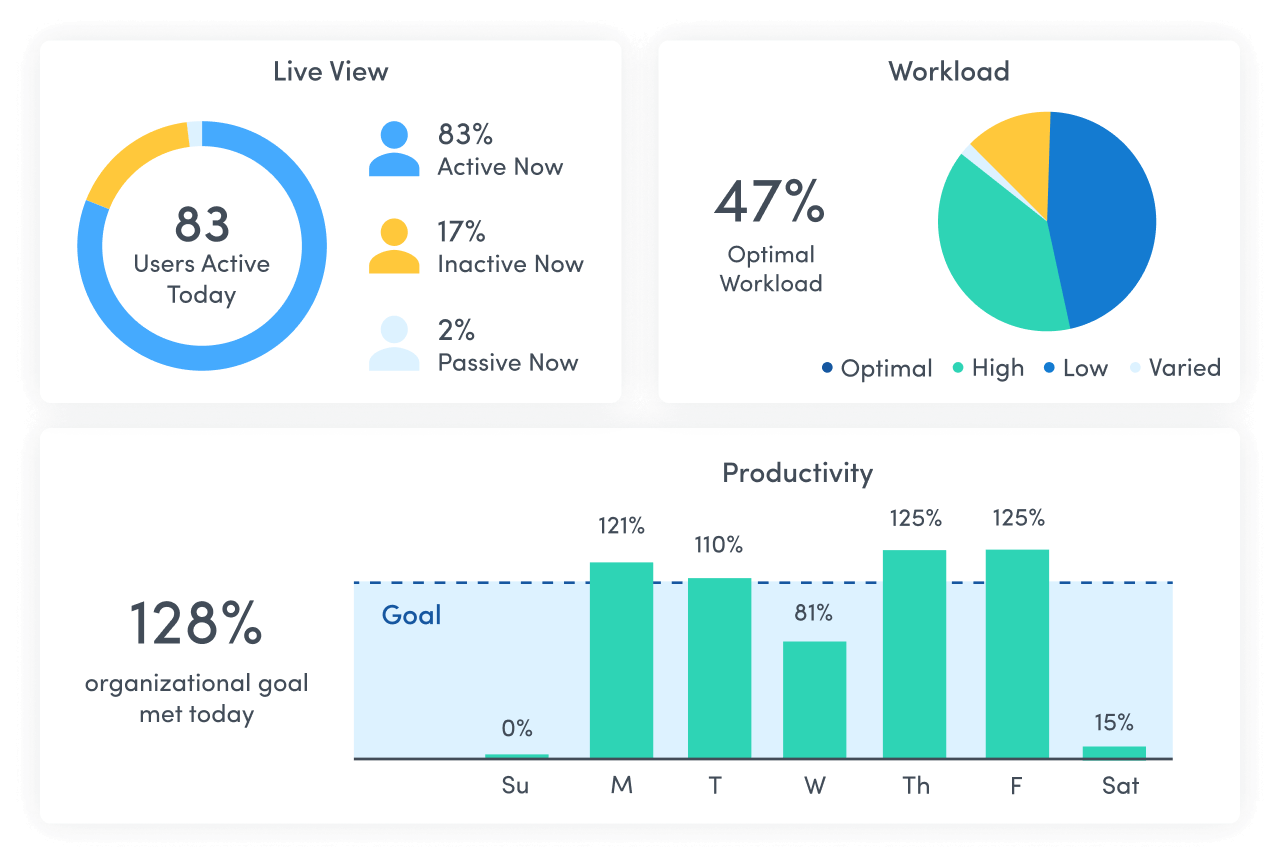
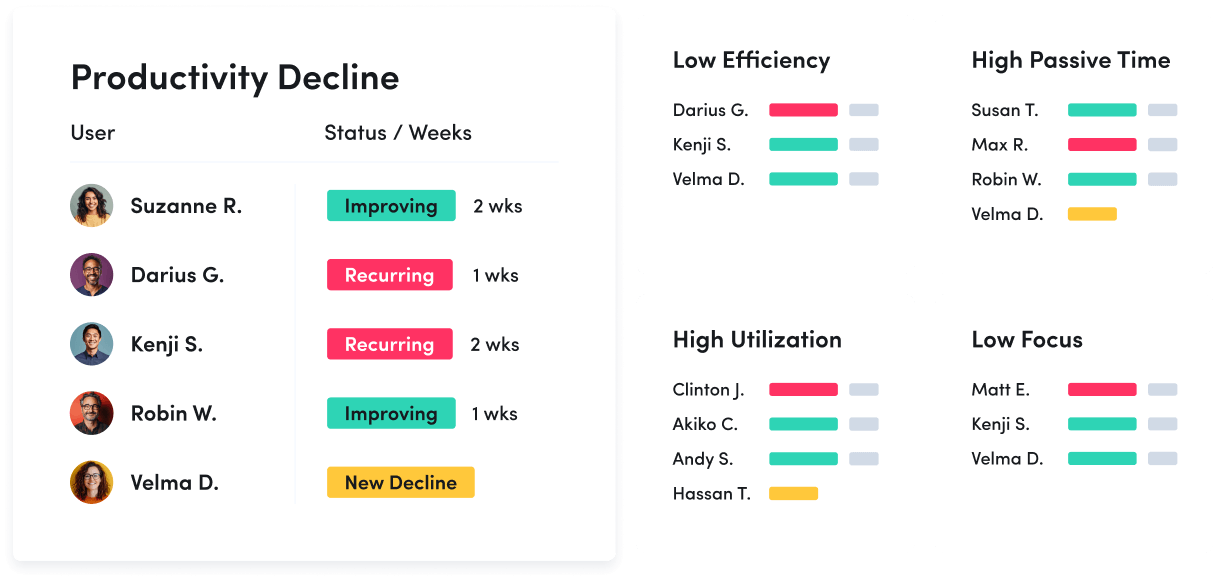
Productivity Optimization
Improve performance with data-driven insight. Quantify productivity, identify capacity and help teams work in more effective, sustainable ways.
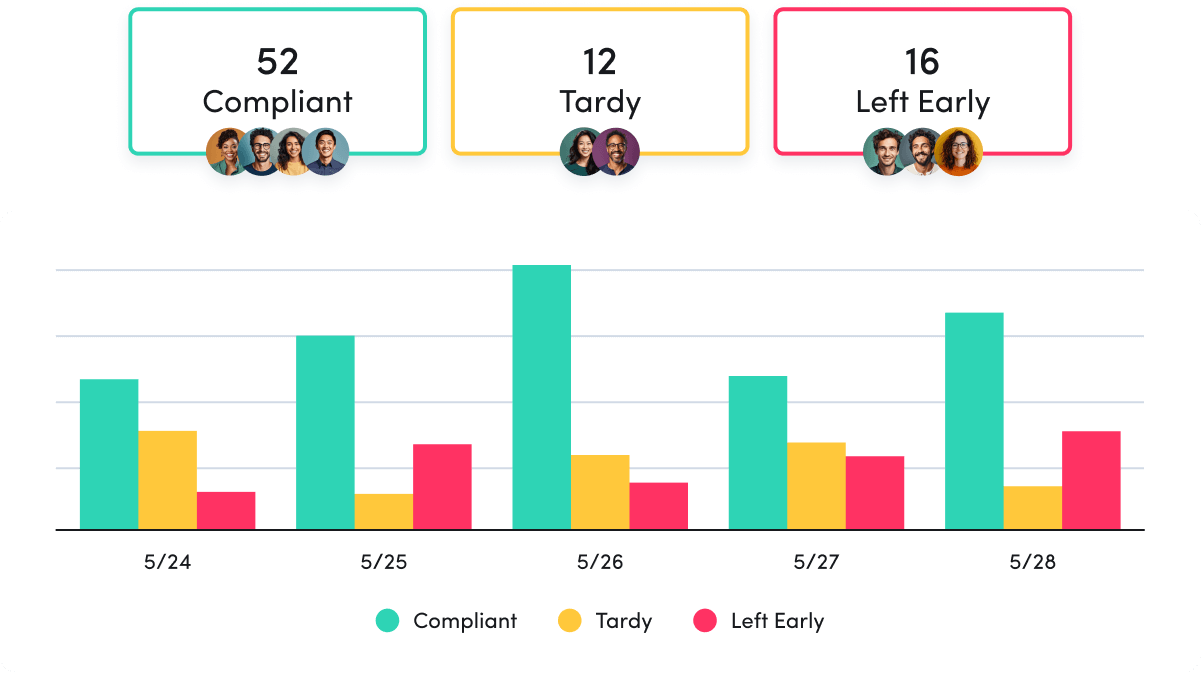
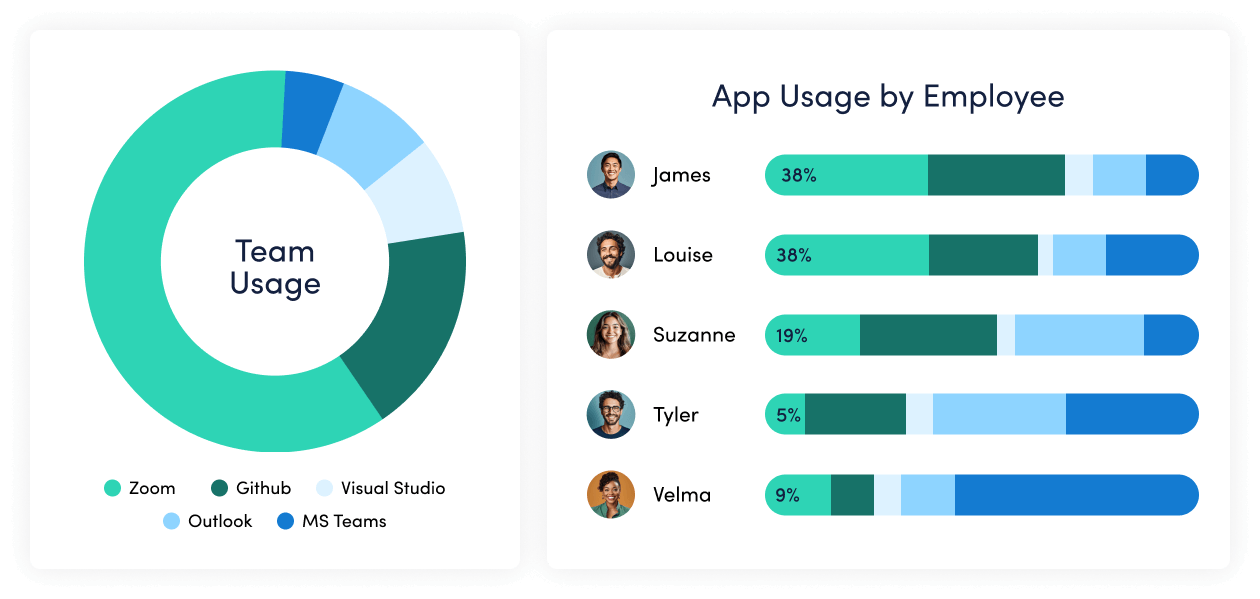
Technology Usage & Compliance
Optimize technology investments and ensure compliance. Understand which applications and websites employees use to drive adoption or cut costs, and enforce policies aimed at mitigating risk.
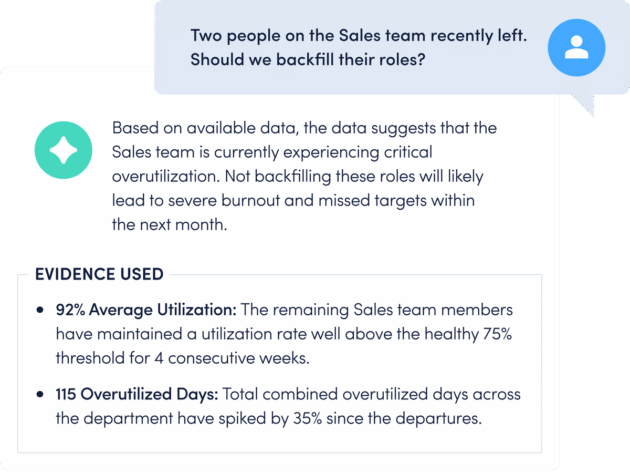
Work Advisor
Let ActivTrak’s conversational AI assistant pull directly from your data for evidenced-backed answers to pressing questions. Skip the manual analysis and get instant insights on work habits, staffing needs, attendance and more.
See what customers say about ActivTrak
Powered by![]()
FAQ: Workforce analytics
What is workforce analytics?
What is workforce analytics?
Workforce (or workplace) analytics is the collection and analysis of digital activity data to create context for how work gets done. With access to this type of data, business leaders make more strategic decisions with regard to operational processes, personnel, technology and more to create better business outcomes.
With workforce analytics software like ActivTrak, leaders and managers are empowered to:
- Track productivity trends to assess engagement for both remote and in-office teams
- Enable effective coaching based on individual productivity patterns
- Understand workflow bottlenecks
- Identify redundant or underutilized technology.
What does workforce analytics software do?
What does workforce analytics software do?
Workforce analytics software takes the guesswork out of understanding how work happens. It collects and analyzes data on productivity, engagement and efficiency—turning raw workforce activity into clear, actionable insights. The goal? To help businesses work smarter, not harder.
Here’s what workforce analytics software can do:
- Spot productivity patterns – See where time is spent, which workflows are efficient and where teams may be struggling.
- Uncover bottlenecks – Identify slowdowns, redundancies and areas where processes can be streamlined.
- Optimize resources – Ensure workloads are balanced, tools are used effectively and technology investments are paying off.
- Track engagement – Detect signs of burnout, disengagement or workload imbalances before they impact performance.
- Predict future needs – Use historical trends to anticipate workforce challenges and make proactive decisions.
By turning complex data into meaningful insights, workforce analytics software empowers leaders to make better decisions, improve employee experience and drive stronger business outcomes.
What are the benefits of workforce analytics software?
What are the benefits of workforce analytics software?
There are several benefits of using workforce analytics software. To start, workforce analytics software takes the manual work out of analyzing workforce activity data points for more accurate trend analysis, data-driven decision-making and quantifiable measures of progress.
This type of software is also:
- Increases productivity: Identify workflow inefficiencies and optimize team performance.
- Strengthens employee engagement: Detect burnout risks and support well-being initiatives.
- Aligns resource allocation: Ensure teams have the right tools and workloads are balanced.
- Optimized technology investments: Track software usage and eliminate underutilized tools.
- Improves talent management: Use data to enhance training, coaching and retention strategies.
- Enhances compliance and security: Monitor digital activity to ensure responsible technology use.
What is the difference between HR analytics and workforce analytics?
What is the difference between HR analytics and workforce analytics?
The difference between HR analytics and workforce analytics is workforce analytics focuses on how work gets done, including technology, processes, personnel and more. The primary driver for implementing workforce analytics is to improve business outcomes and mitigate risk.
On the other hand, HR analytics (often referred to as people analytics) is the analysis of data around human costs in business, including training and development, onboarding, recruitment and turnover. HR analytics or people analytics focuses singularly on personnel. The reason for analyzing HR analytics is specifically to improve human resources management in your business.
Who uses workforce analytics software?
Who uses workforce analytics software?
Workforce analytics software isn’t just for one department—it’s a tool used across industries and roles, fueling smarter decision-making, sharper business performance and stronger employee engagement. Whether you’re optimizing workflows, tracking productivity or driving strategic workplace initiatives, the right data delivers a competitive edge.
Here’s how different roles use workforce analytics software:
- HR professionals: Gain deeper insights into talent management, training and development and workforce trends, helping to reduce turnover and strengthen retention strategies.
- Operations leaders: Pinpoint inefficiencies, eliminate workflow bottlenecks and ensure teams are aligned with business goals for maximum impact.
- IT teams: Track software adoption, uncover underutilized tools and optimize technology investments to cut unnecessary costs.
- Executives and business leaders: Connect workforce data to big-picture business outcomes, improving productivity, profitability and long-term strategy.
- People managers: Monitor real-time productivity patterns, tailor coaching efforts and foster a data-driven approach to employee performance and engagement.
As workforce analytics software continues to evolve, its value extends beyond leadership teams. More organizations are empowering individual contributors with insights into their own work habits, allowing them to refine their approach, boost efficiency and work smarter—not just harder.
Want to learn more about workforce analytics software? Explore these resources
Want to learn more about workforce analytics software? Explore these resources
In addition to information about ActivTrak’s software, we’ve created several resources detailing workforce analytics and how it helps organizations manage their remote and hybrid teams. Browse the list below to make a more informed decision when choosing a workforce analytics software for your organization.
- Privacy and Workforce Analytics: The Employee Perspective
- Privacy and Workforce Analytics: The HR Perspective
- Privacy & Workforce Analytics: The Manager Perspective
- Privacy and Workforce Analytics: The Executive Perspective
- Must-Know Workforce Analytics Trends
- How to Get Hybrid Work Right with Workforce Analytics
- Remote Workforce Analytics – The Key to Remote Team Productivity
- What is the Difference Between Workforce Analytics and HR Analytics?
- Do You Need Remote Desktop Monitoring or Remote Workforce Analytics?