PRODUCTIVITY
Introduction
The ActivTrak Productivity Lab is committed to challenging workplace assumptions and elevating today’s workplace realities and discourse.
This year, our State of the Workplace report provides a deep-dive examination of workplace behaviors spanning three years of customer data, including 135,098 employees and 958 customers — representing one of the most direct and objective studies of productivity behaviors.
The study focuses on three key areas of research — productivity, engagement and technology —
to reveal the current state of work, and how organizations can better anticipate and plan for the future of work.
Notably, we found workdays are shorter and productivity remains steady. Burnout is in decline, which should boost positive engagement and utilization.
However, disengagement is growing — possibly due to previously burned-out employees increasingly checking out. This may lead to problems of underutilization, but also presents opportunities to make better use of untapped workforce capacity and improve business outcomes.
Unless noted, all findings represent year-over-year comparisons between 2022 and 2023 (Data Set A).
Executive Summary
Productivity
- Employees were +8 mins/day more productive in the first half of 2023 vs.
the second half. - The workday got 15% shorter from Q1 2021 to Q4 2023, with employees finishing their tasks in less time.
Engagement
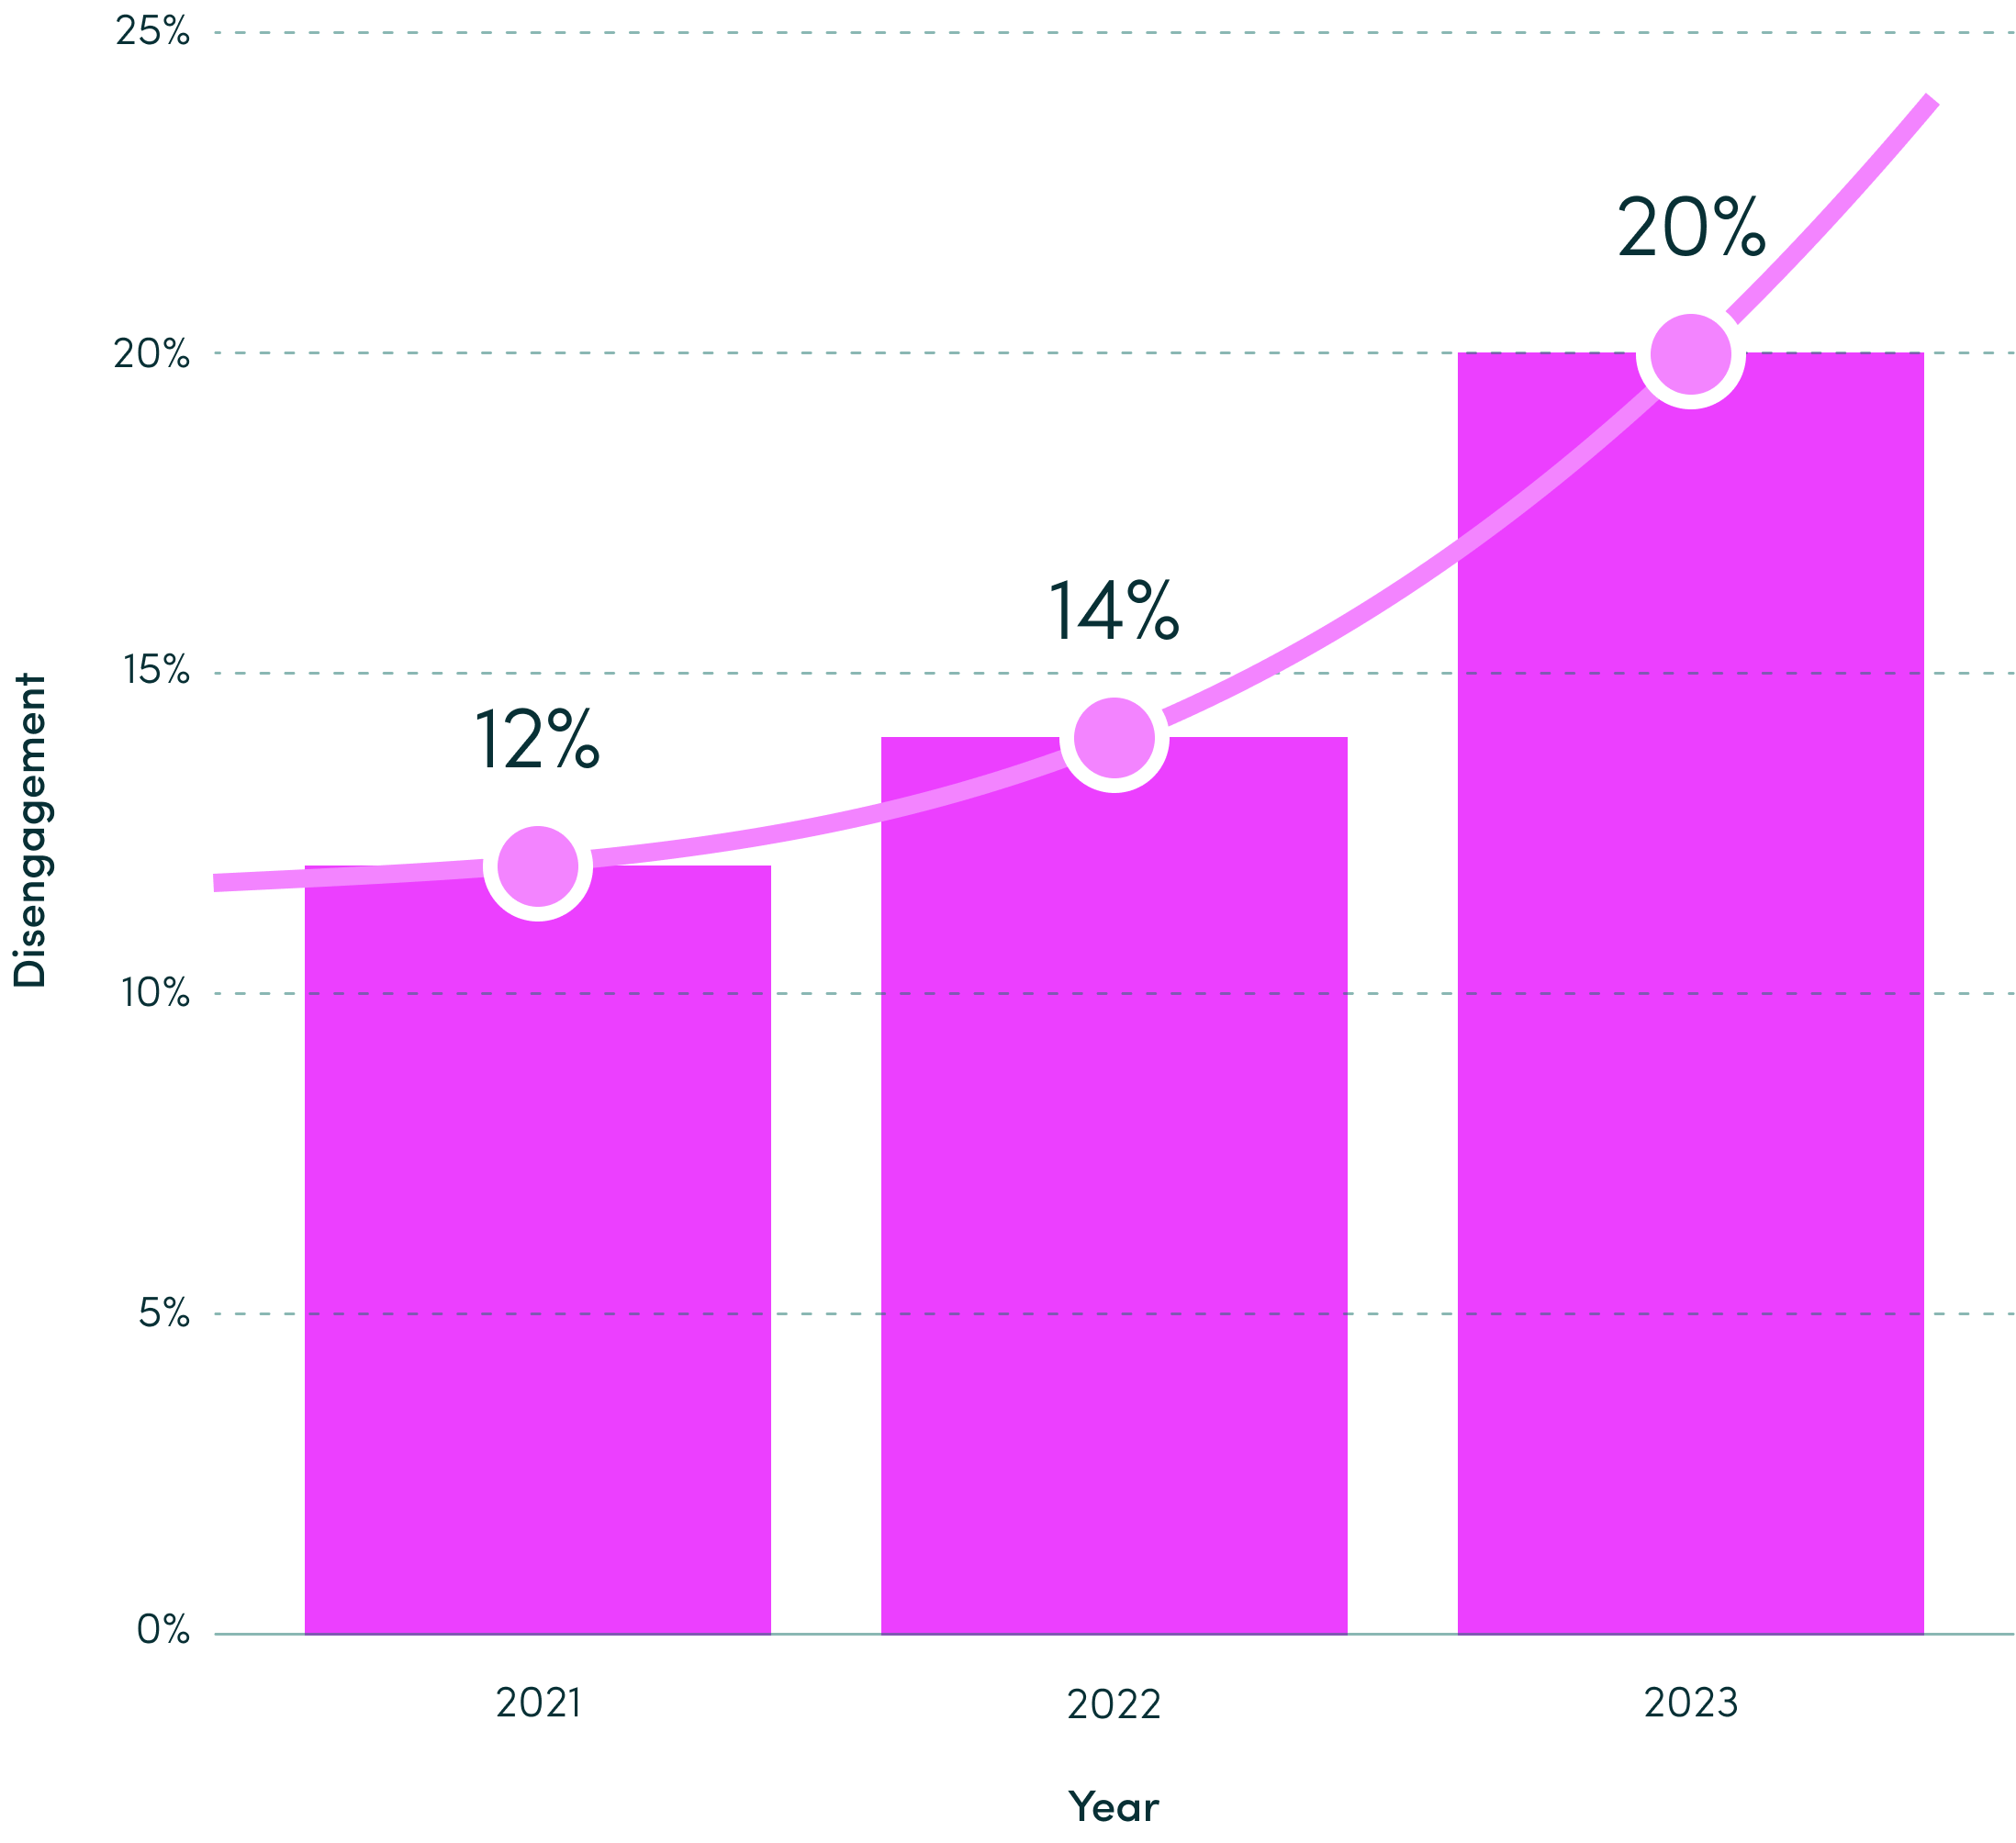
- 20% of employees were disengaged, due to underutilization, up 67% since 2021.
- Workload imbalance costs organizations millions of dollars.
Tech: AI Adoption
- 22% of employees used AI tools in 2023, an increase of 50% from Q1 to Q4.
- Factors such as industry, company size and workplace environment influenced AI tool adoption.
AREA OF STUDY
Productivity
The Lab studied:
- What does an average day of digital work look like?
- Do behaviors vary during a typical workweek or throughout the year?
Key Findings:
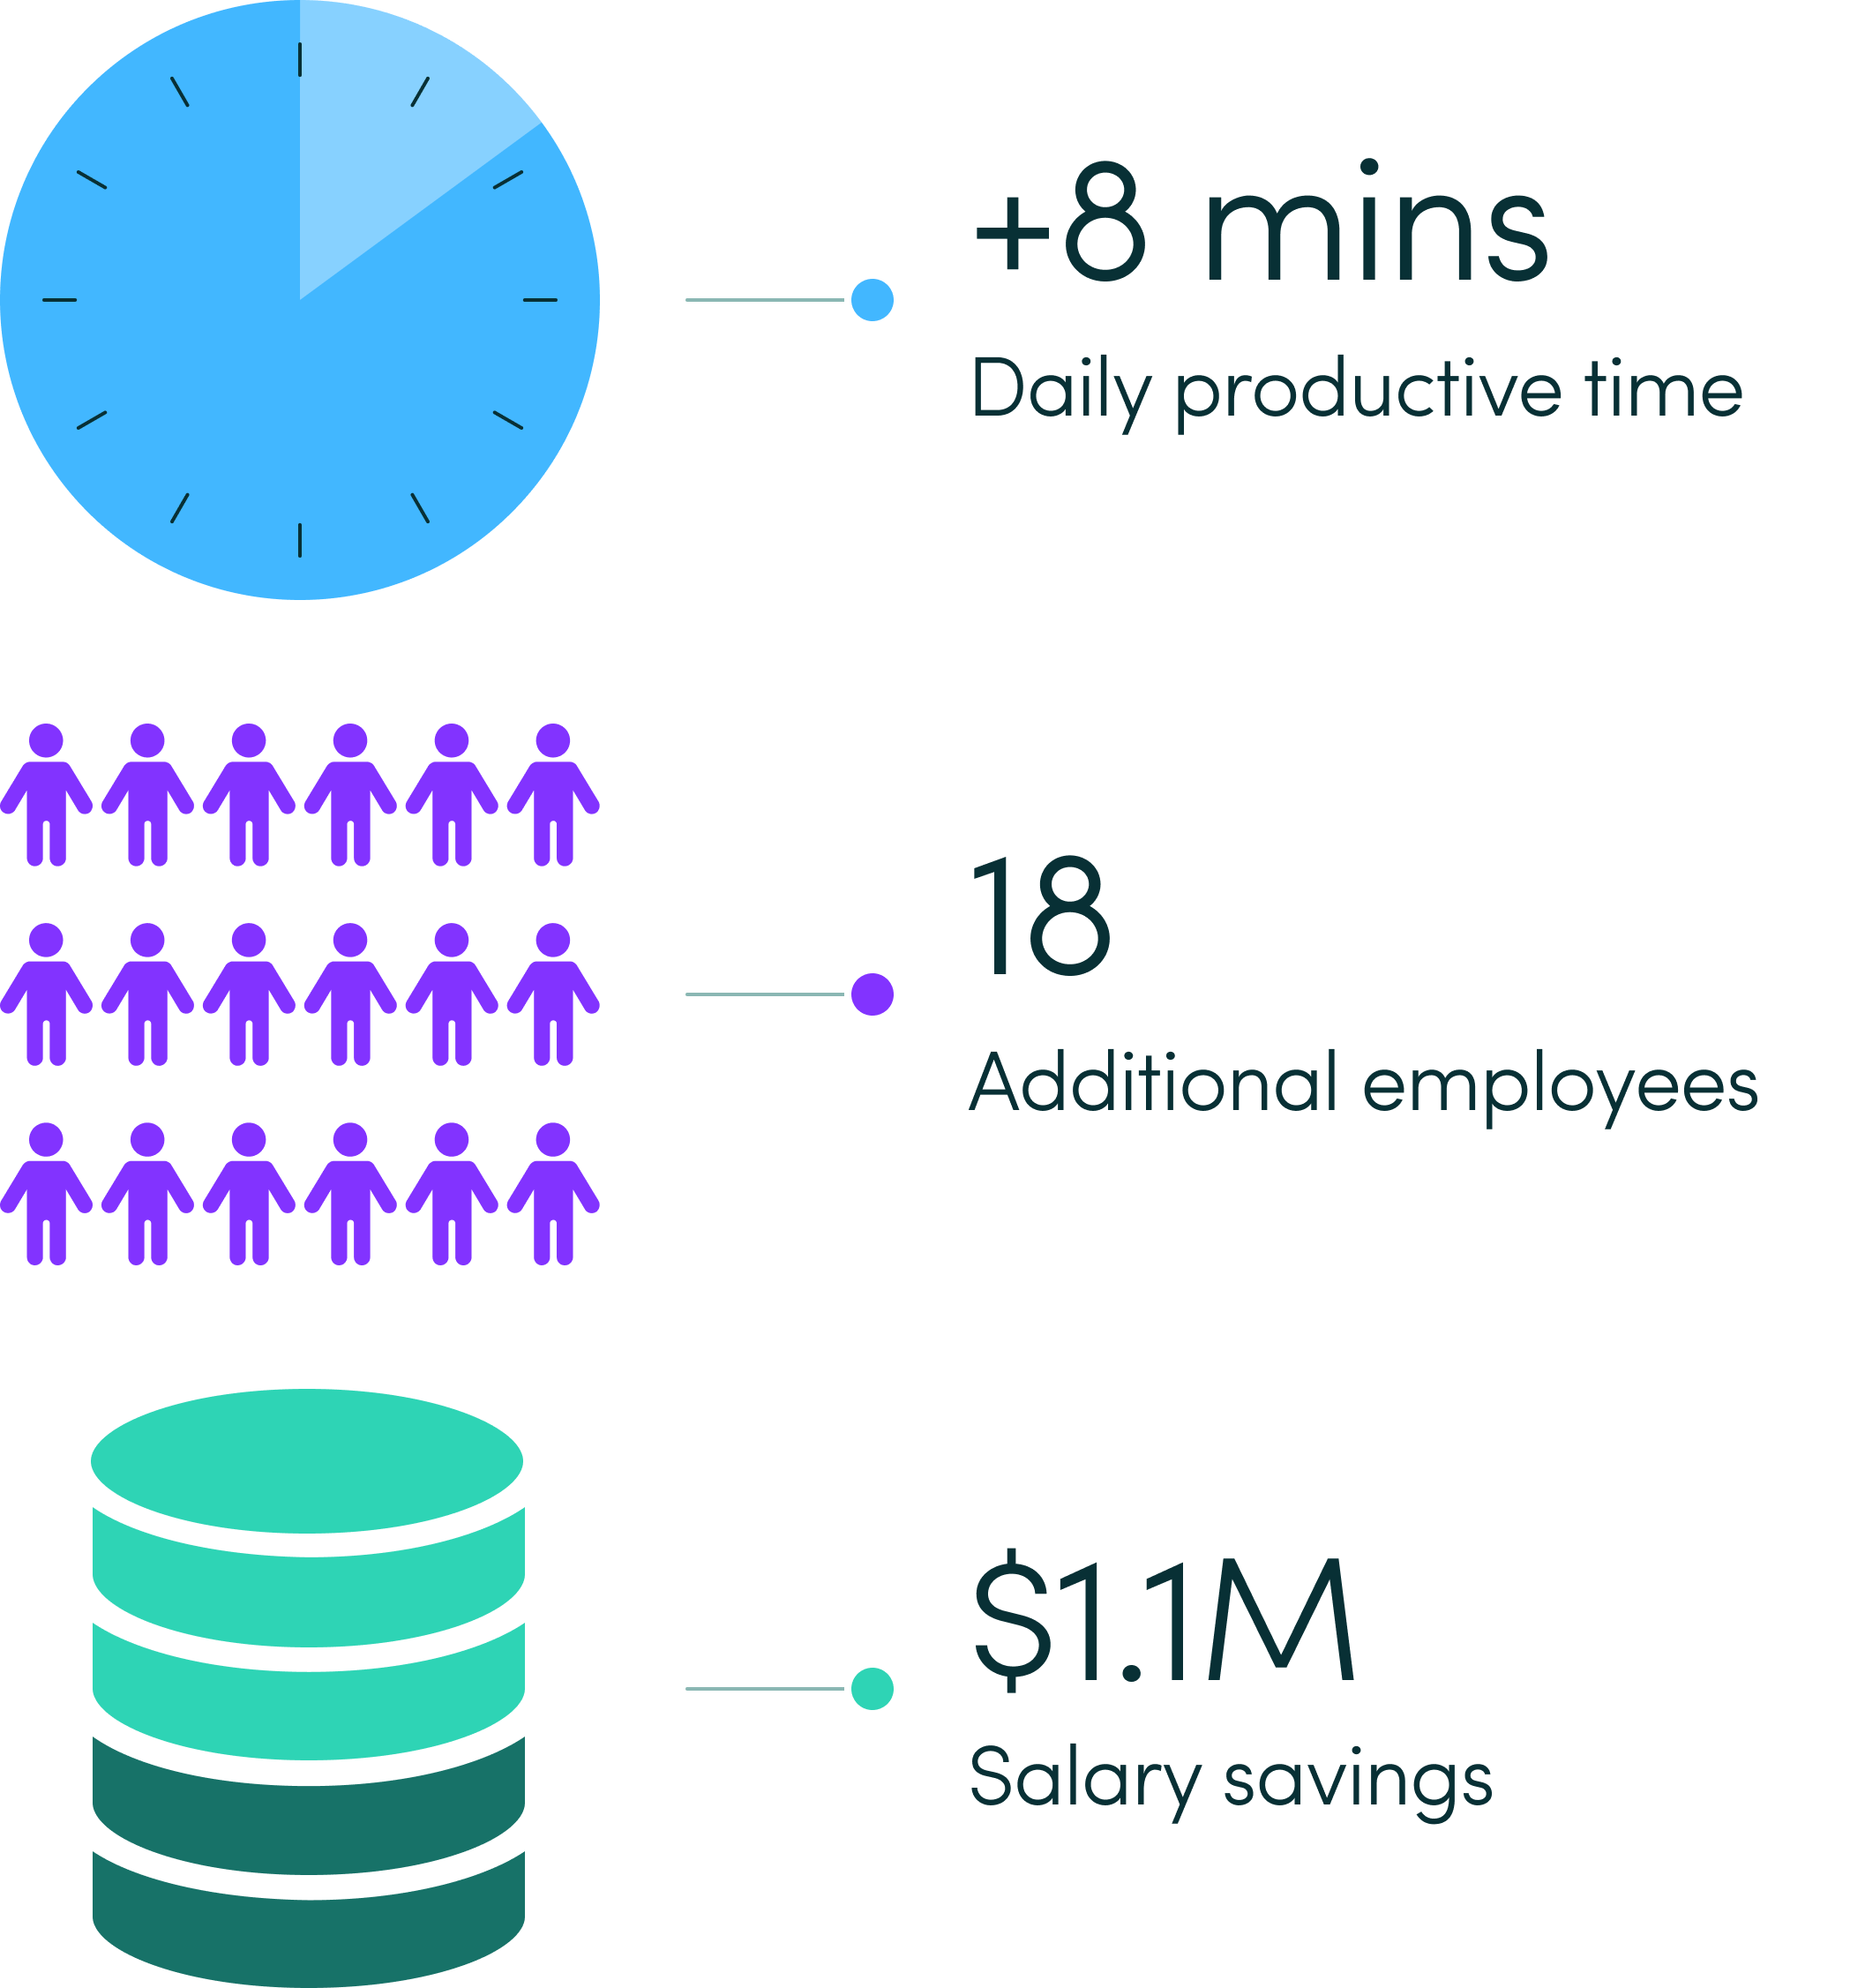
- Employees were +8 mins/day more productive in the first half of 2023 vs. the second half.
- The workday got 15% shorter from Q1 2021 to Q4 2023, with employees finishing their tasks in less time.
If an organization with 1,000 employees maintained productivity levels seen in the first half of the year, it would gain additional workload capacity of 18 full-time employees, worth approx. $1.1M.*
*Based on +8 mins/day per employee at $60K annual salary.
Definitions: Capacity Productive Time
Additional Workload Capacity
PRODUCTIVITY
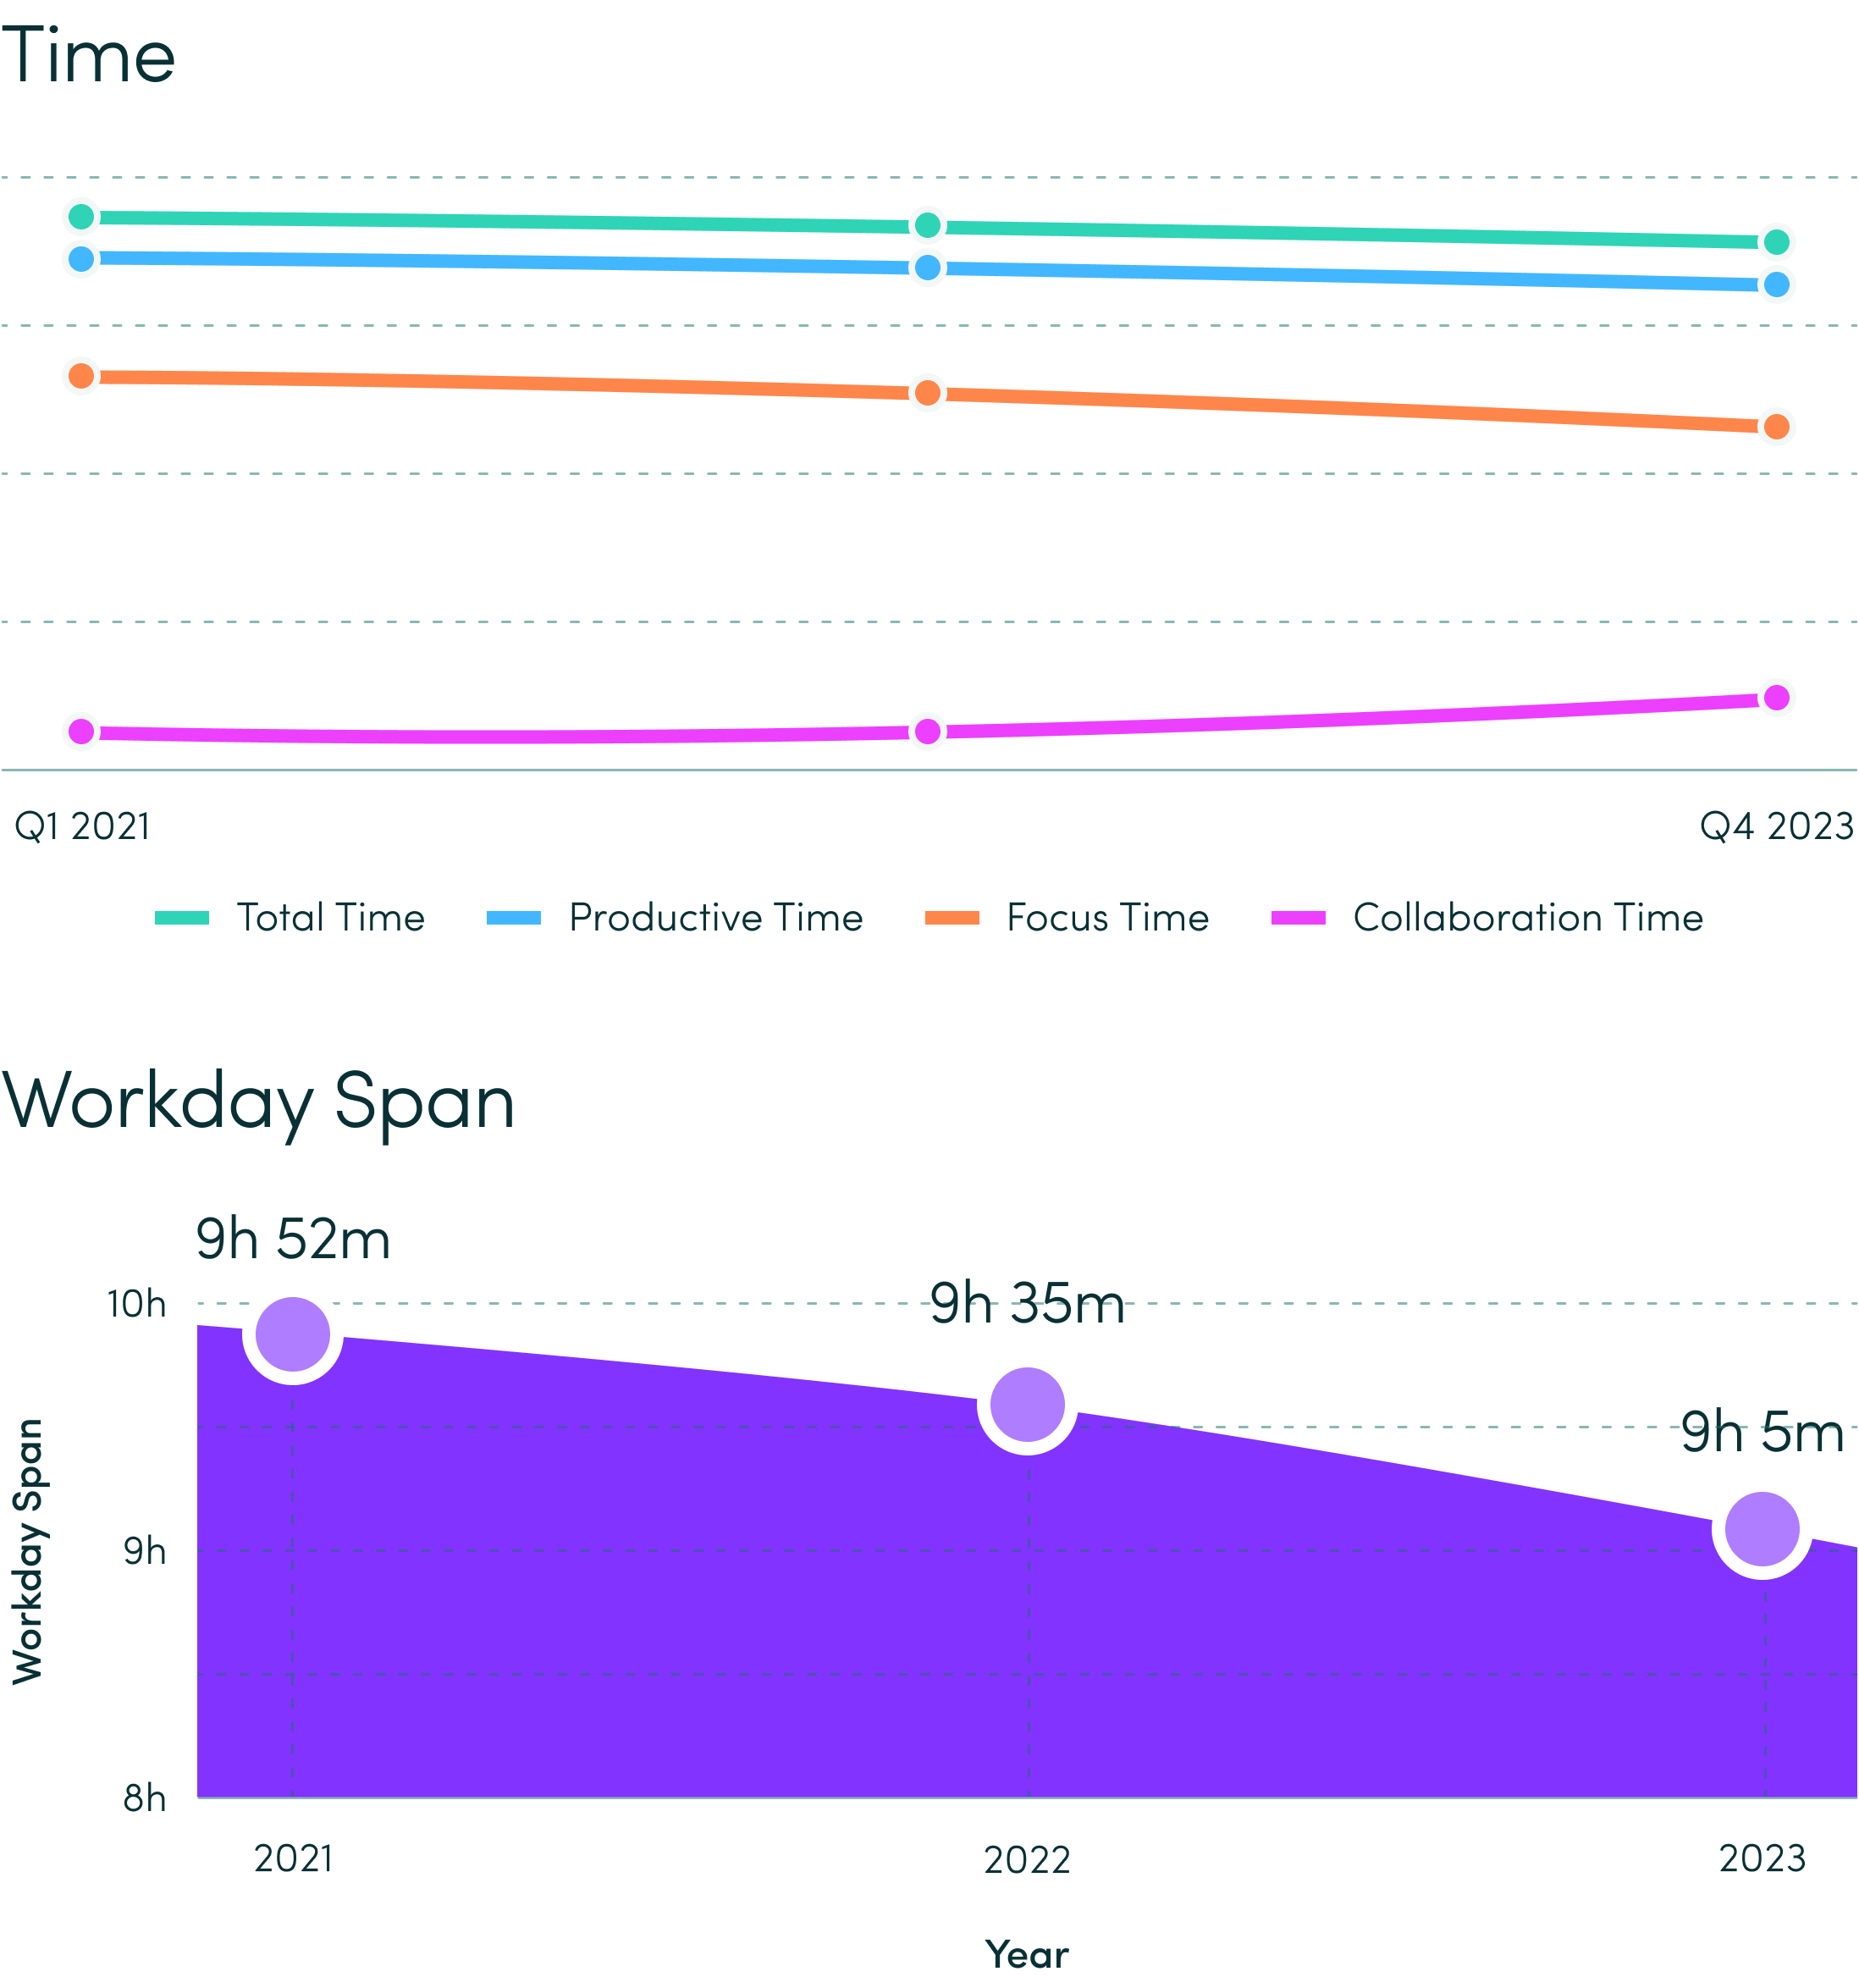
The workday got 15% shorter from Q1 2021 to Q4 2023, with employees finishing their tasks in less time.
- Time spent on collaborative activities such as chat and messaging increased slightly.
- Meanwhile, total digital activity, productive time and focus time stayed relatively constant.
- While workdays got significantly shorter (dropping from 9 hrs 52 mins in 2021 to 9 hrs
5 mins in 2023), efficiency remained flat.
Definitions: Collaboration
Efficiency Focus Total Time Workday Span
Anatomy of a Day
PRODUCTIVITY
Lab Guidance
- Utilize workplace analytics software to boost performance management, enhance employee productivity and maximize workforce investments.
- Continuously analyze current and long-term data to pinpoint gaps and obstacles, and identify employees who may benefit from additional coaching or training.
Resources
According to Lattice’s State of People Strategy Report, the highest-performing teams — those exceeding their goals — are 2.6x more likely to be investing in performance management software than the lowest performers are.
According to ActivTrak polls, among organizations that do not currently collect activity data, 27% are unsure how to begin and 22% are concerned about the cultural implications of doing so.
AREA OF STUDY
Engagement
The Lab studied:
- How pervasive are disengagement and burnout-related risks?
- Have weekend working habits shifted?
Key Findings:
- 20% of employees were disengaged, due to underutilization, up 67% since 2021.
- Workload imbalance costs organizations millions of dollars.
ENGAGEMENT
20% of employees were disengaged due to underutilization, up 67% since 2021.
- Additionally, 7% of employees risked burnout due to overutilization, down slightly since 2021.
- 4% of employees worked on weekends, down from 5% in 2022 (Data Set B).
Definitions: Burnout
Disengagement Overutilization Underutilization Weekend Work
Engagement
Increase in disengagement since 2021
ENGAGEMENT
Workload imbalance costs organizations millions of dollars.
- Employees who are burned out or disengaged are more likely to leave.
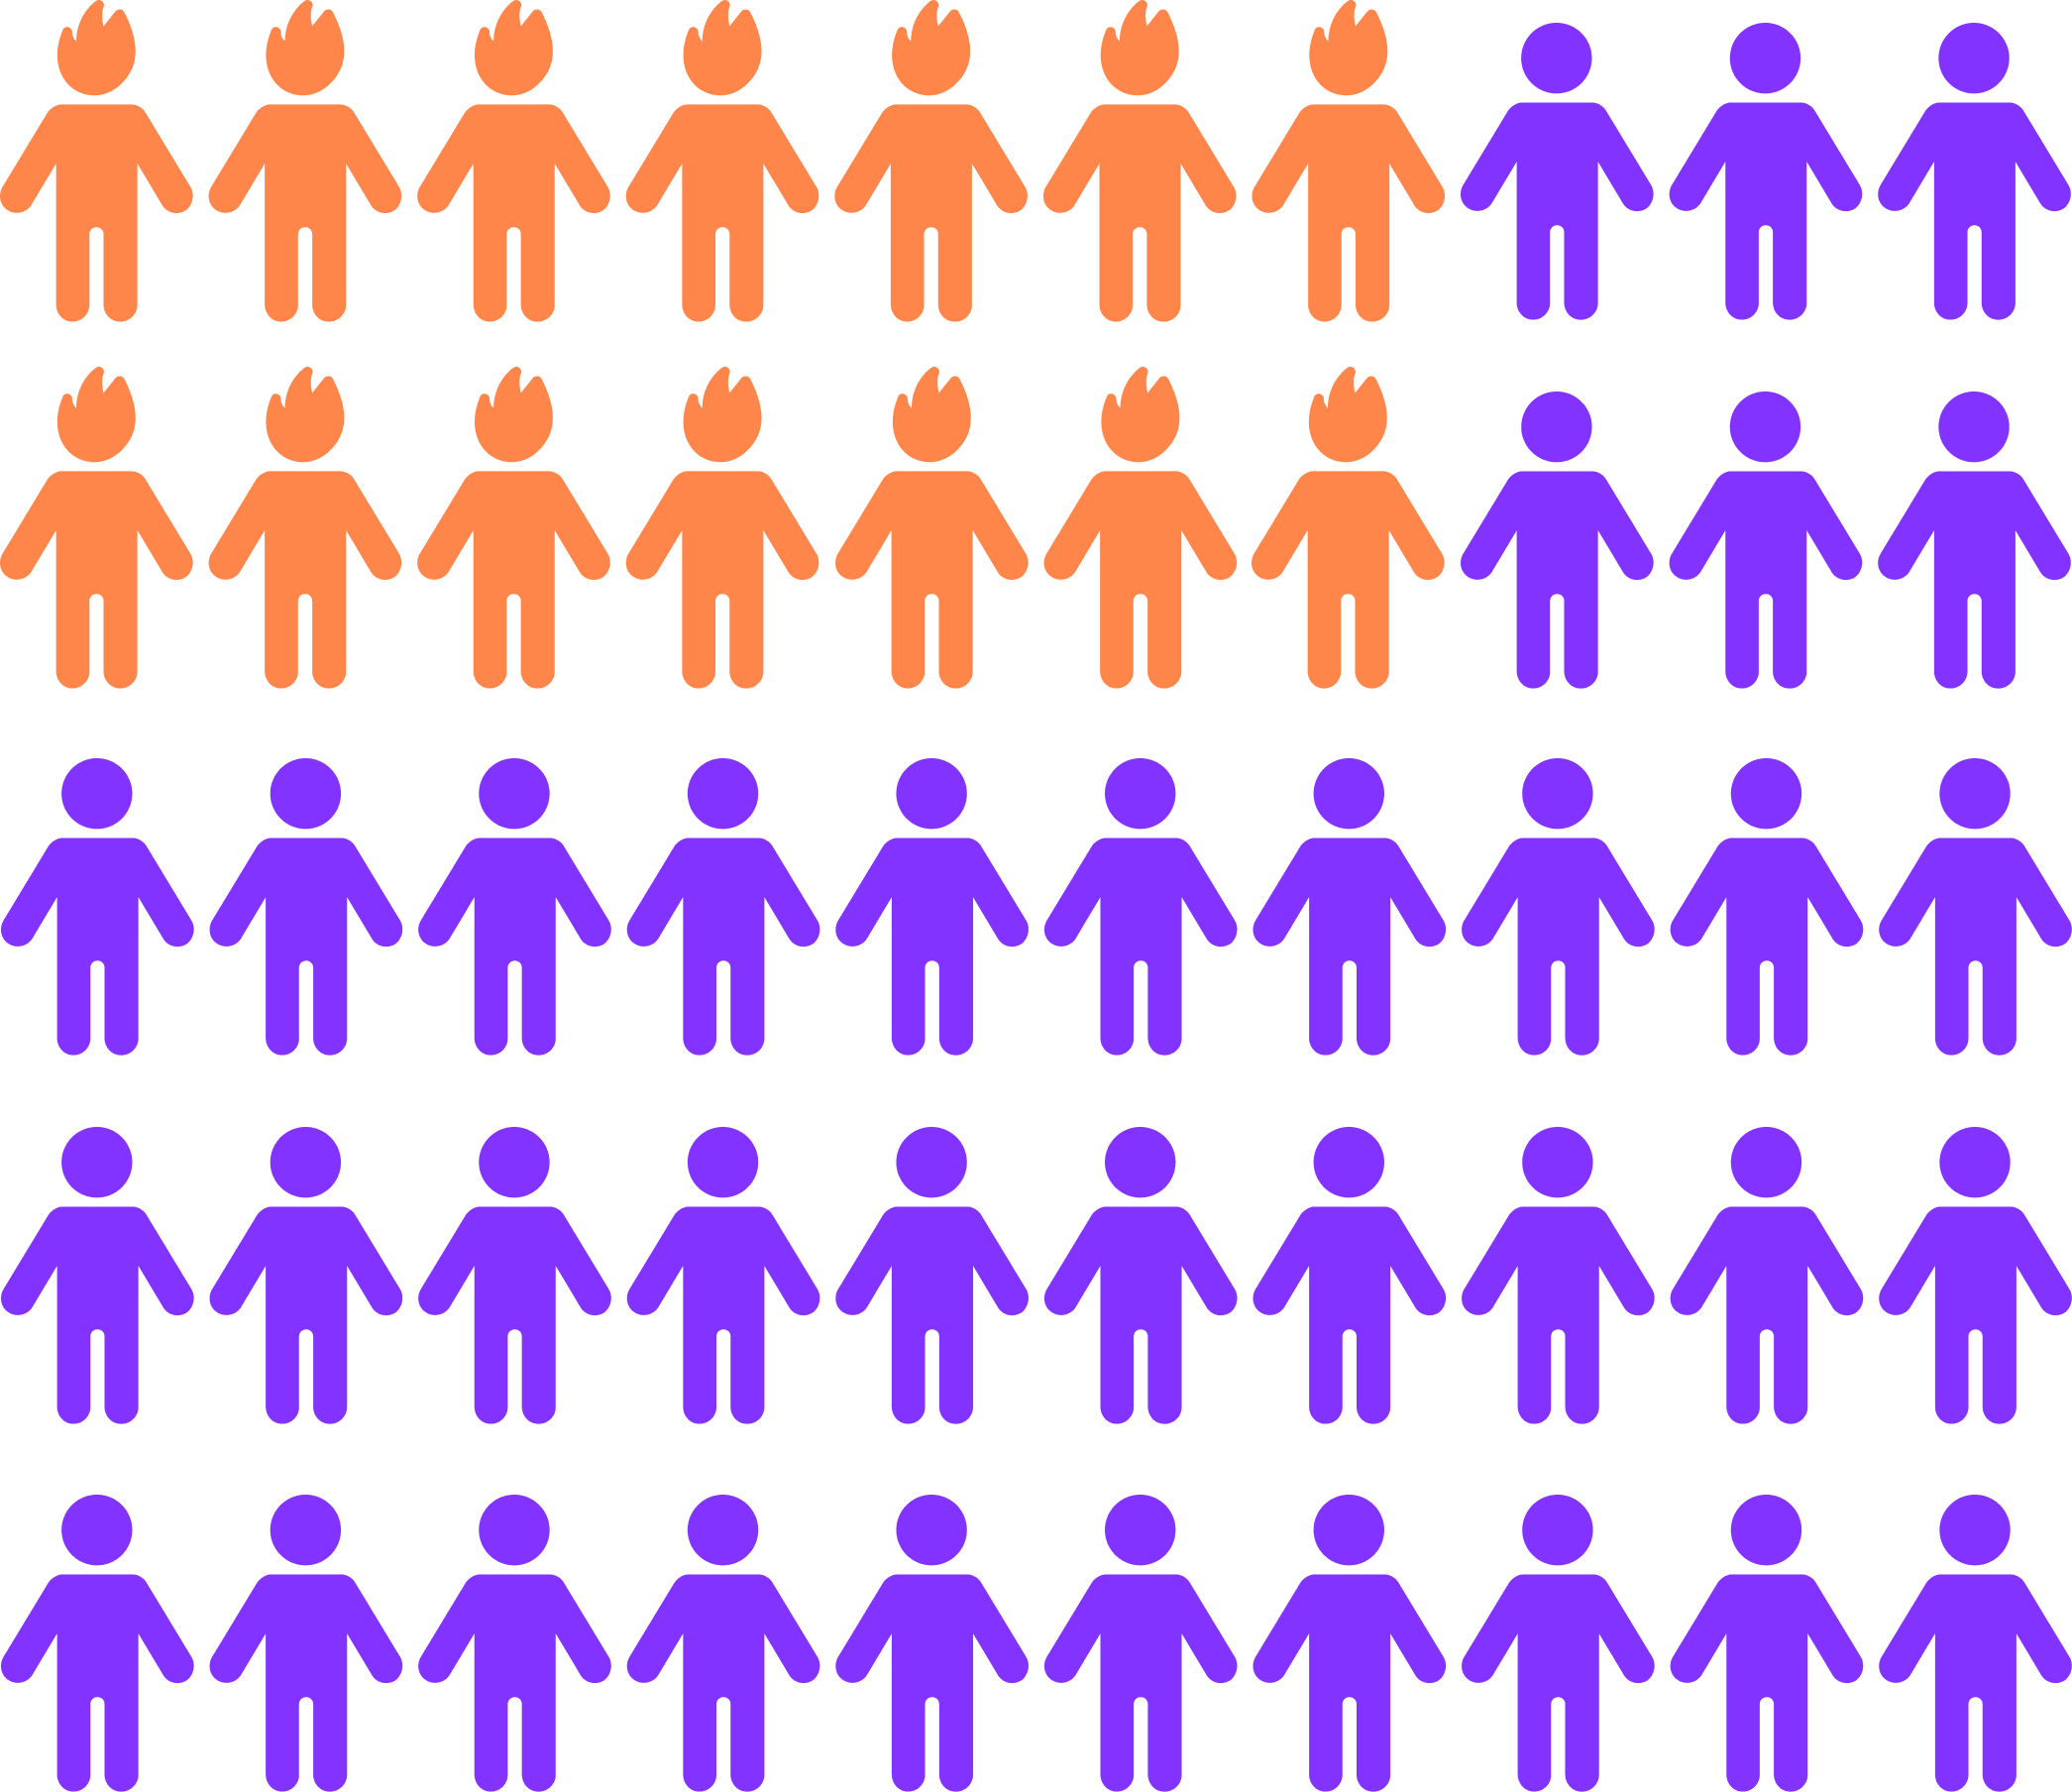
For an organization with 1,000 employees, workload imbalance that leads to attrition equals a potential loss of 70 employees, or $2.1M.*
*Based on 20% annual voluntary turnover and replacement costs equal to half of a $60K annual salary.
Workload Balance
27% of employees risk attrition due to burnout or disengagement
ENGAGEMENT
Lab Guidance
- Gather context through team meetings and one-on-one discussions to identify issues and offer targeted support to employees who are overburdened or underutilized.
- Encourage employee development by demonstrating how their daily work contributes to the organization’s broader strategic goals.
Resources
According to a recent Gallup study, only one-third of employees are engaged at their jobs, while one-half are giving minimum effort.
Per Deloitte’s Global Human Capital Trends survey, 95% of HR executives agree that employee burnout impacts retention.
According to ActivTrak polls, one out of every three organizations cited attrition and burnout as their primary challenge looking ahead to 2024.
AREA OF STUDY
Tech: AI Adoption
The Lab studied:
- How do organizations leverage AI tools?
- Have employee work habits and productivity been impacted by the increased accessibility of generative AI?
Key Findings:
- 22% of employees used AI tools in 2023, an increase of 50% from Q1 to Q4.
- Factors such as industry, company size and workplace environment influenced AI tool adoption.
TECH: AI ADOPTION
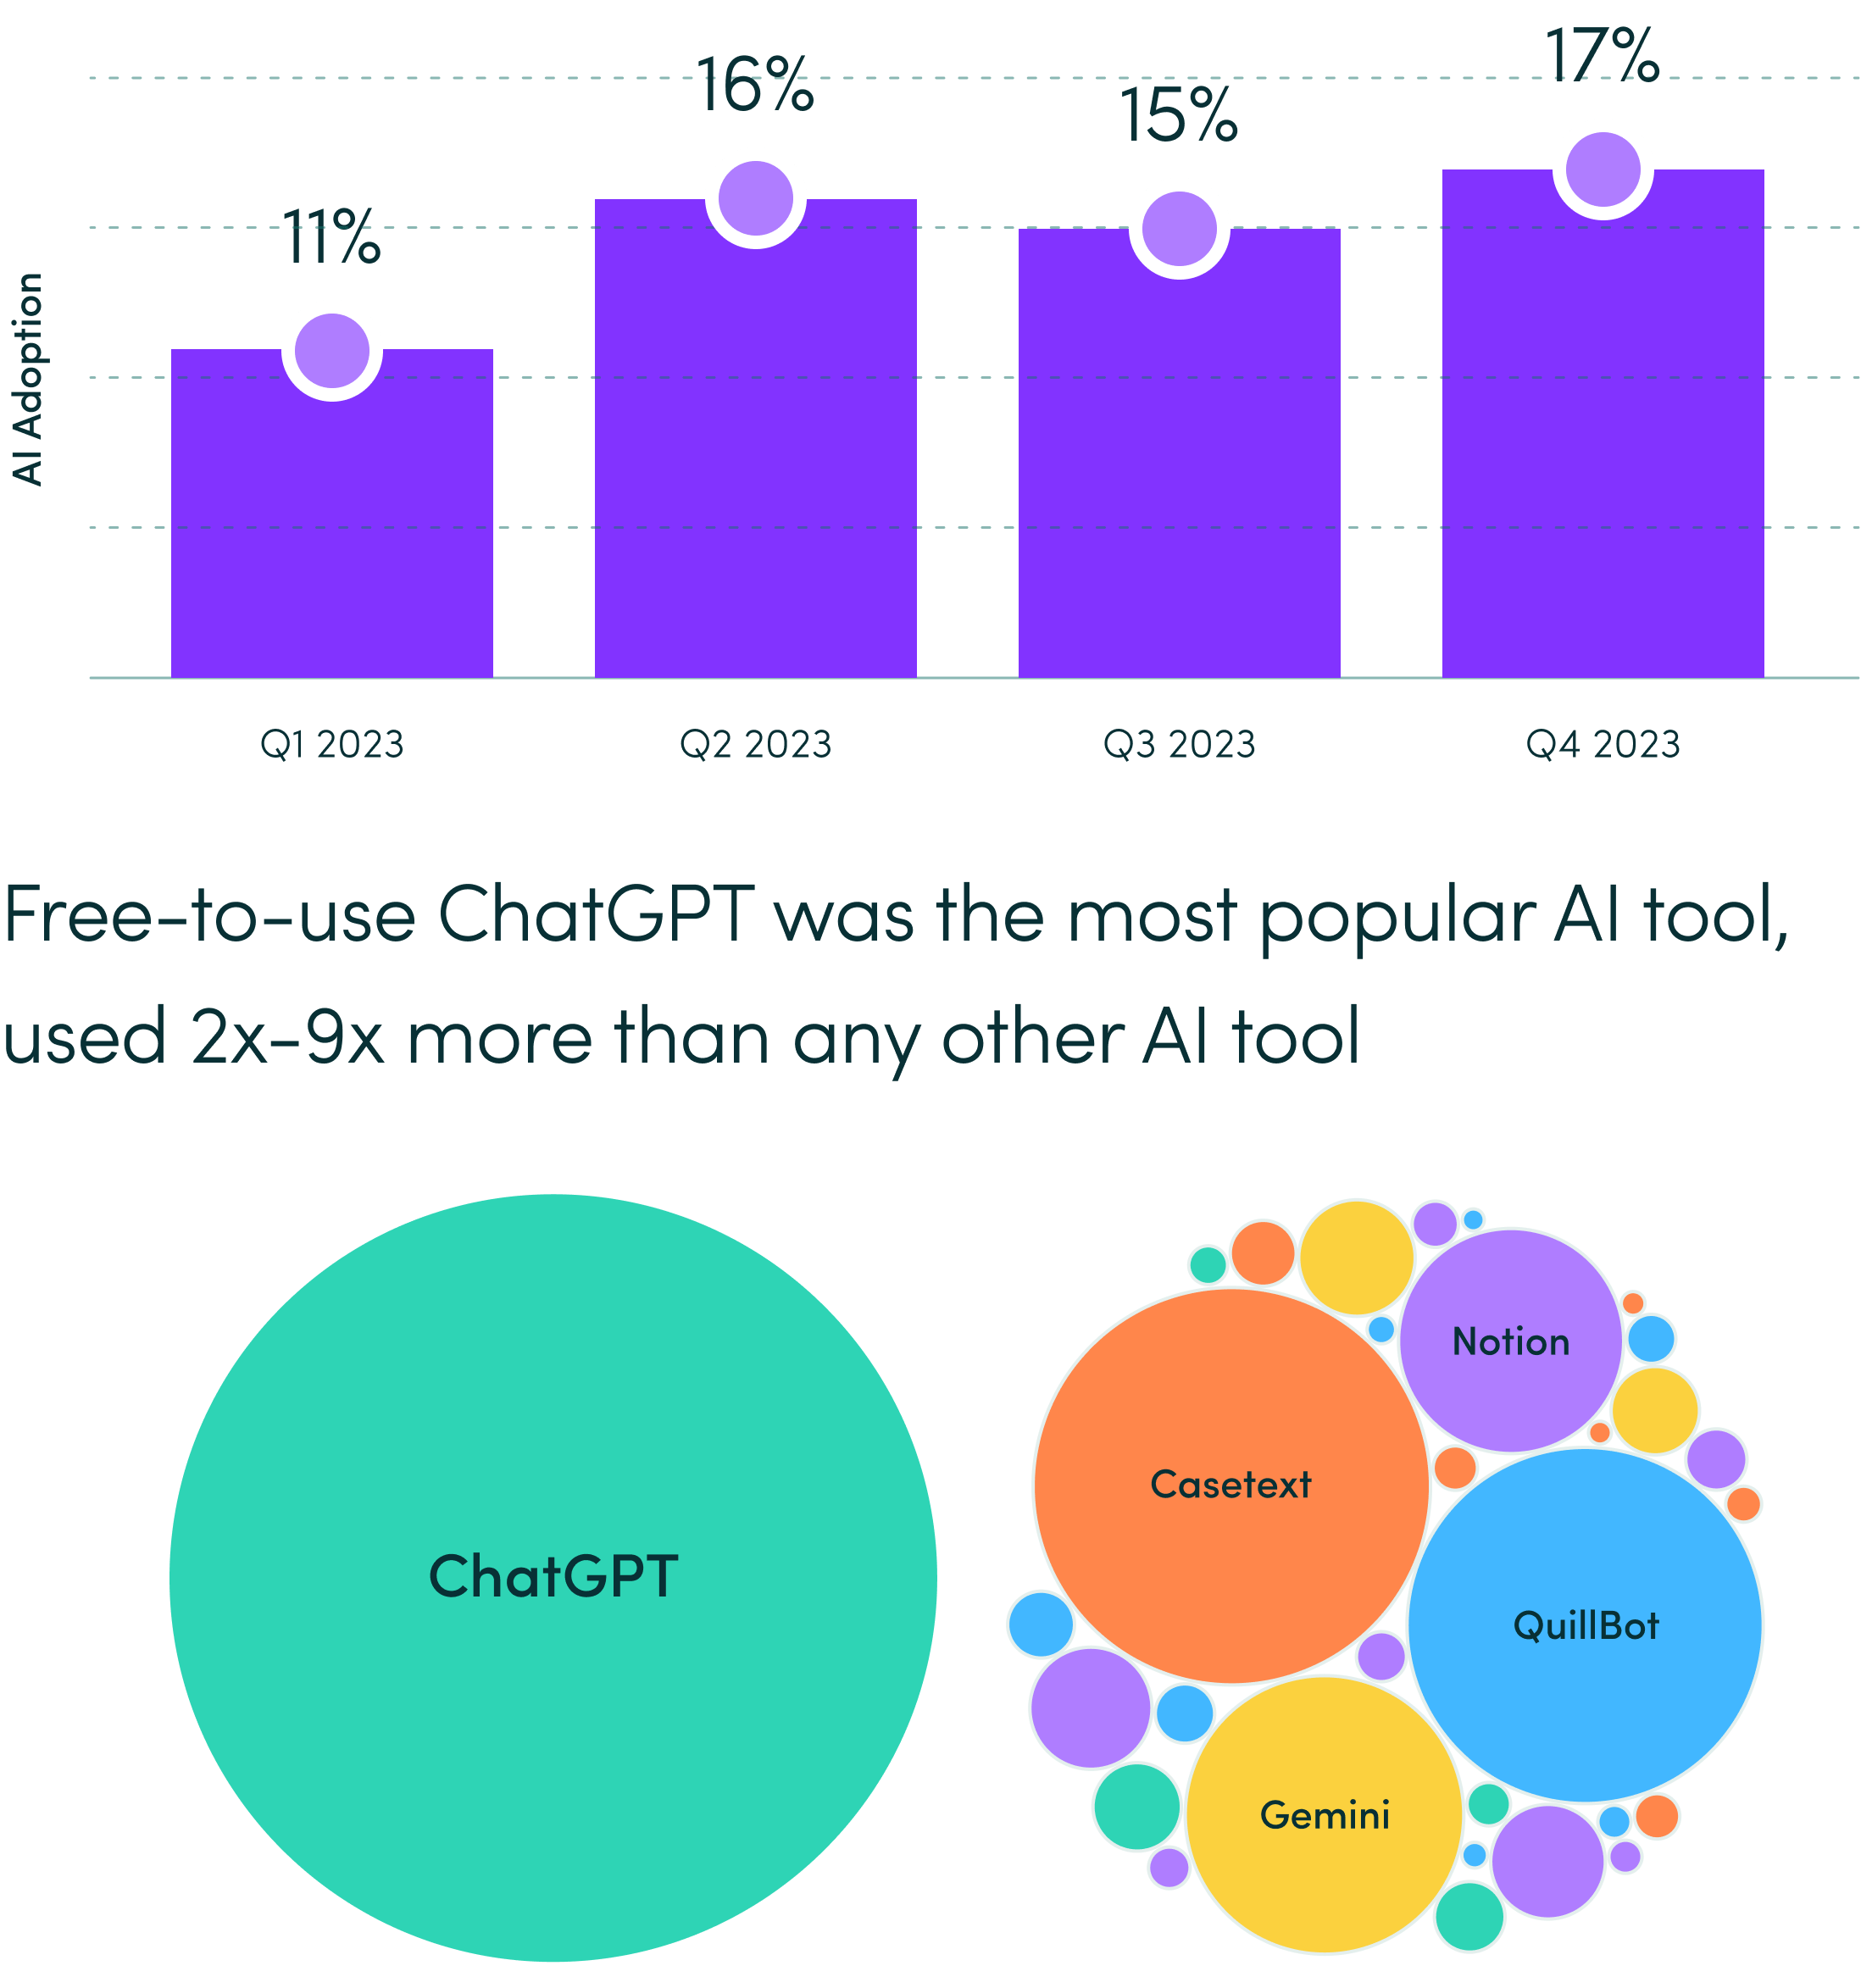
22% of employees used AI tools in 2023, an increase of 50% from Q1 to Q4.
- While AI usage increased, there was no apparent impact on productivity when comparing employees who used AI tools to those who did not.
- Across any given industry, 1 in 10 employees used AI tools.
- 114 unique AI tools were used, with the top five being ChatGPT, Casetext, QuillBot, Gemini (Bard) and Notion.
AI Adoption
TECH: AI ADOPTION
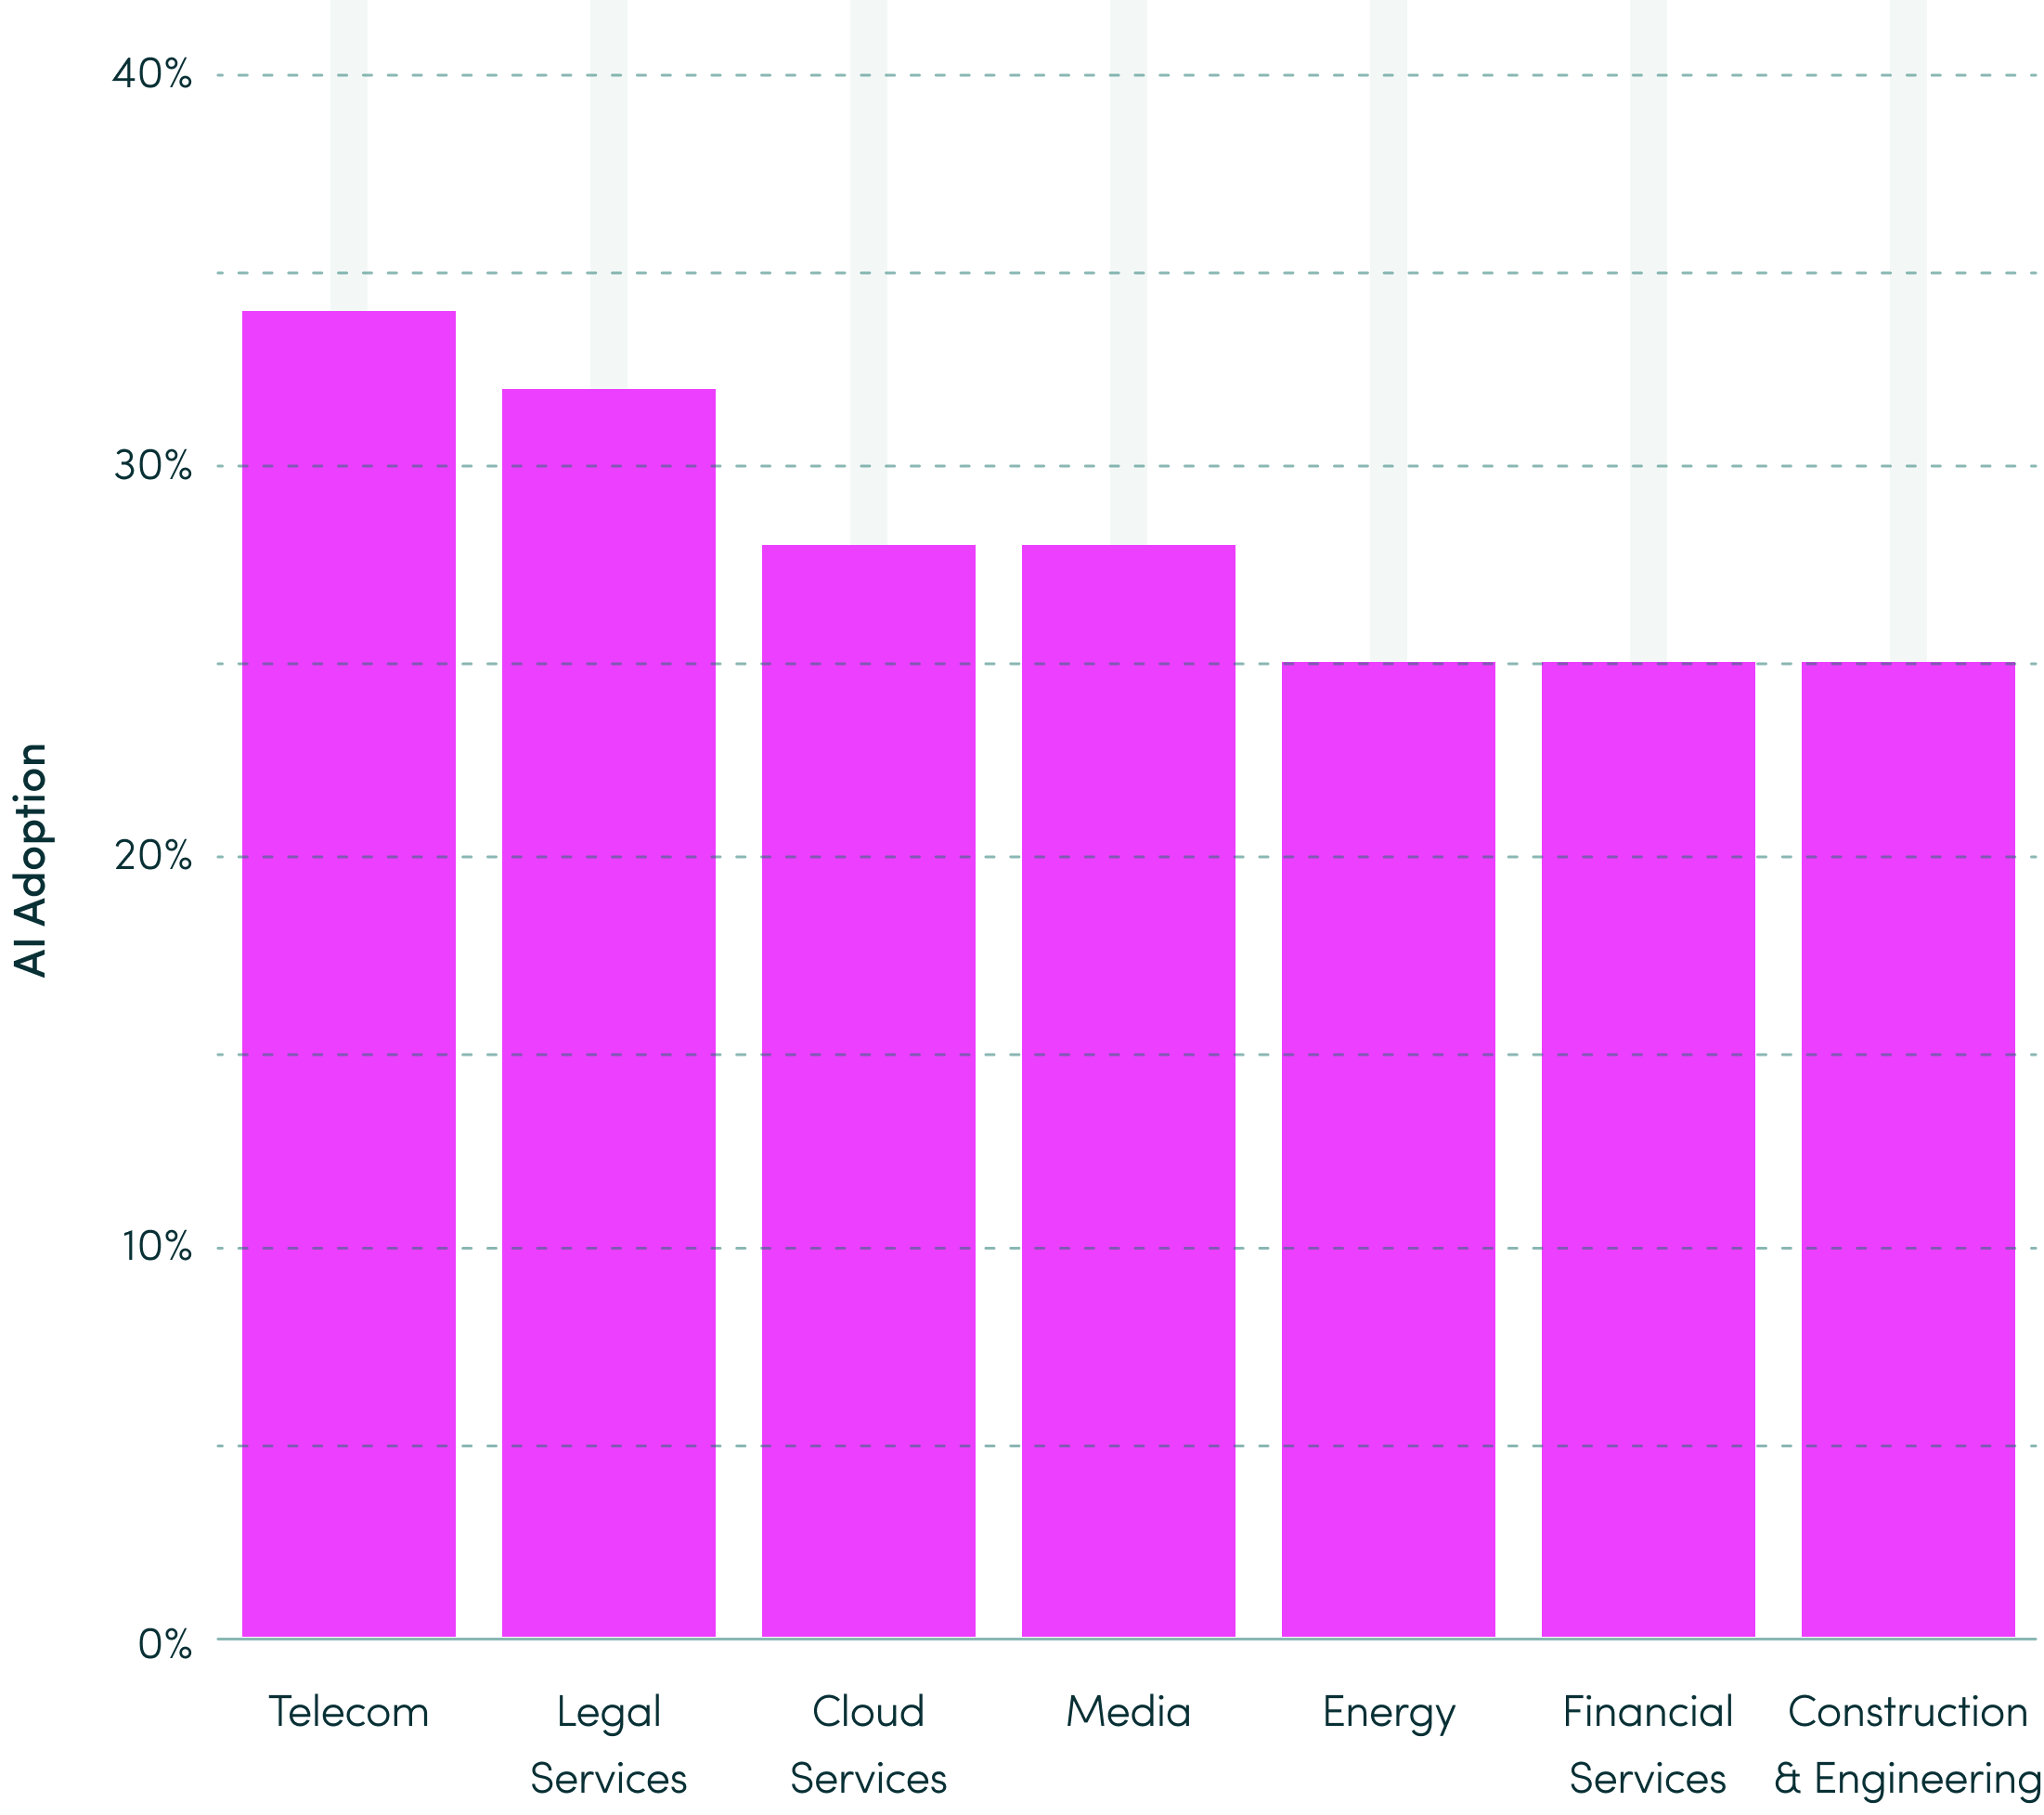
Factors such as industry, company size and workplace environment influenced AI tool adoption.
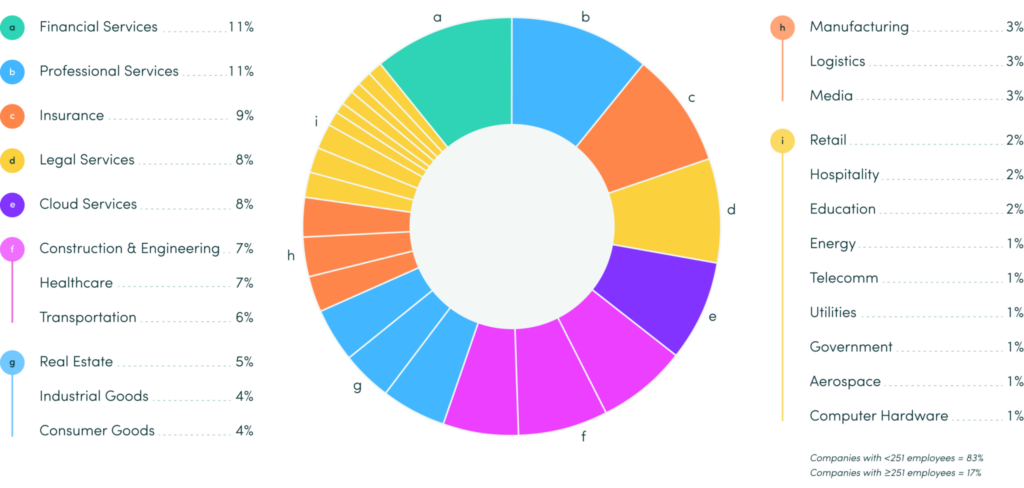
- Industry: Telecom (34%) and Legal Services (32%) had the highest AI tool usage among employees, while Real Estate (13%) and Government (9%) had the lowest.
- Company size: A slightly higher percentage of employees in mid market organizations (23%) used AI tools compared to their larger (21%) and smaller (21%) counterparts.
- Workplace environment: Employees were 5% more likely to use AI tools when working remotely than when working from the office.
AI Adoption by Industry
Industries with ≥ 25% usage
TECH: AI ADOPTION
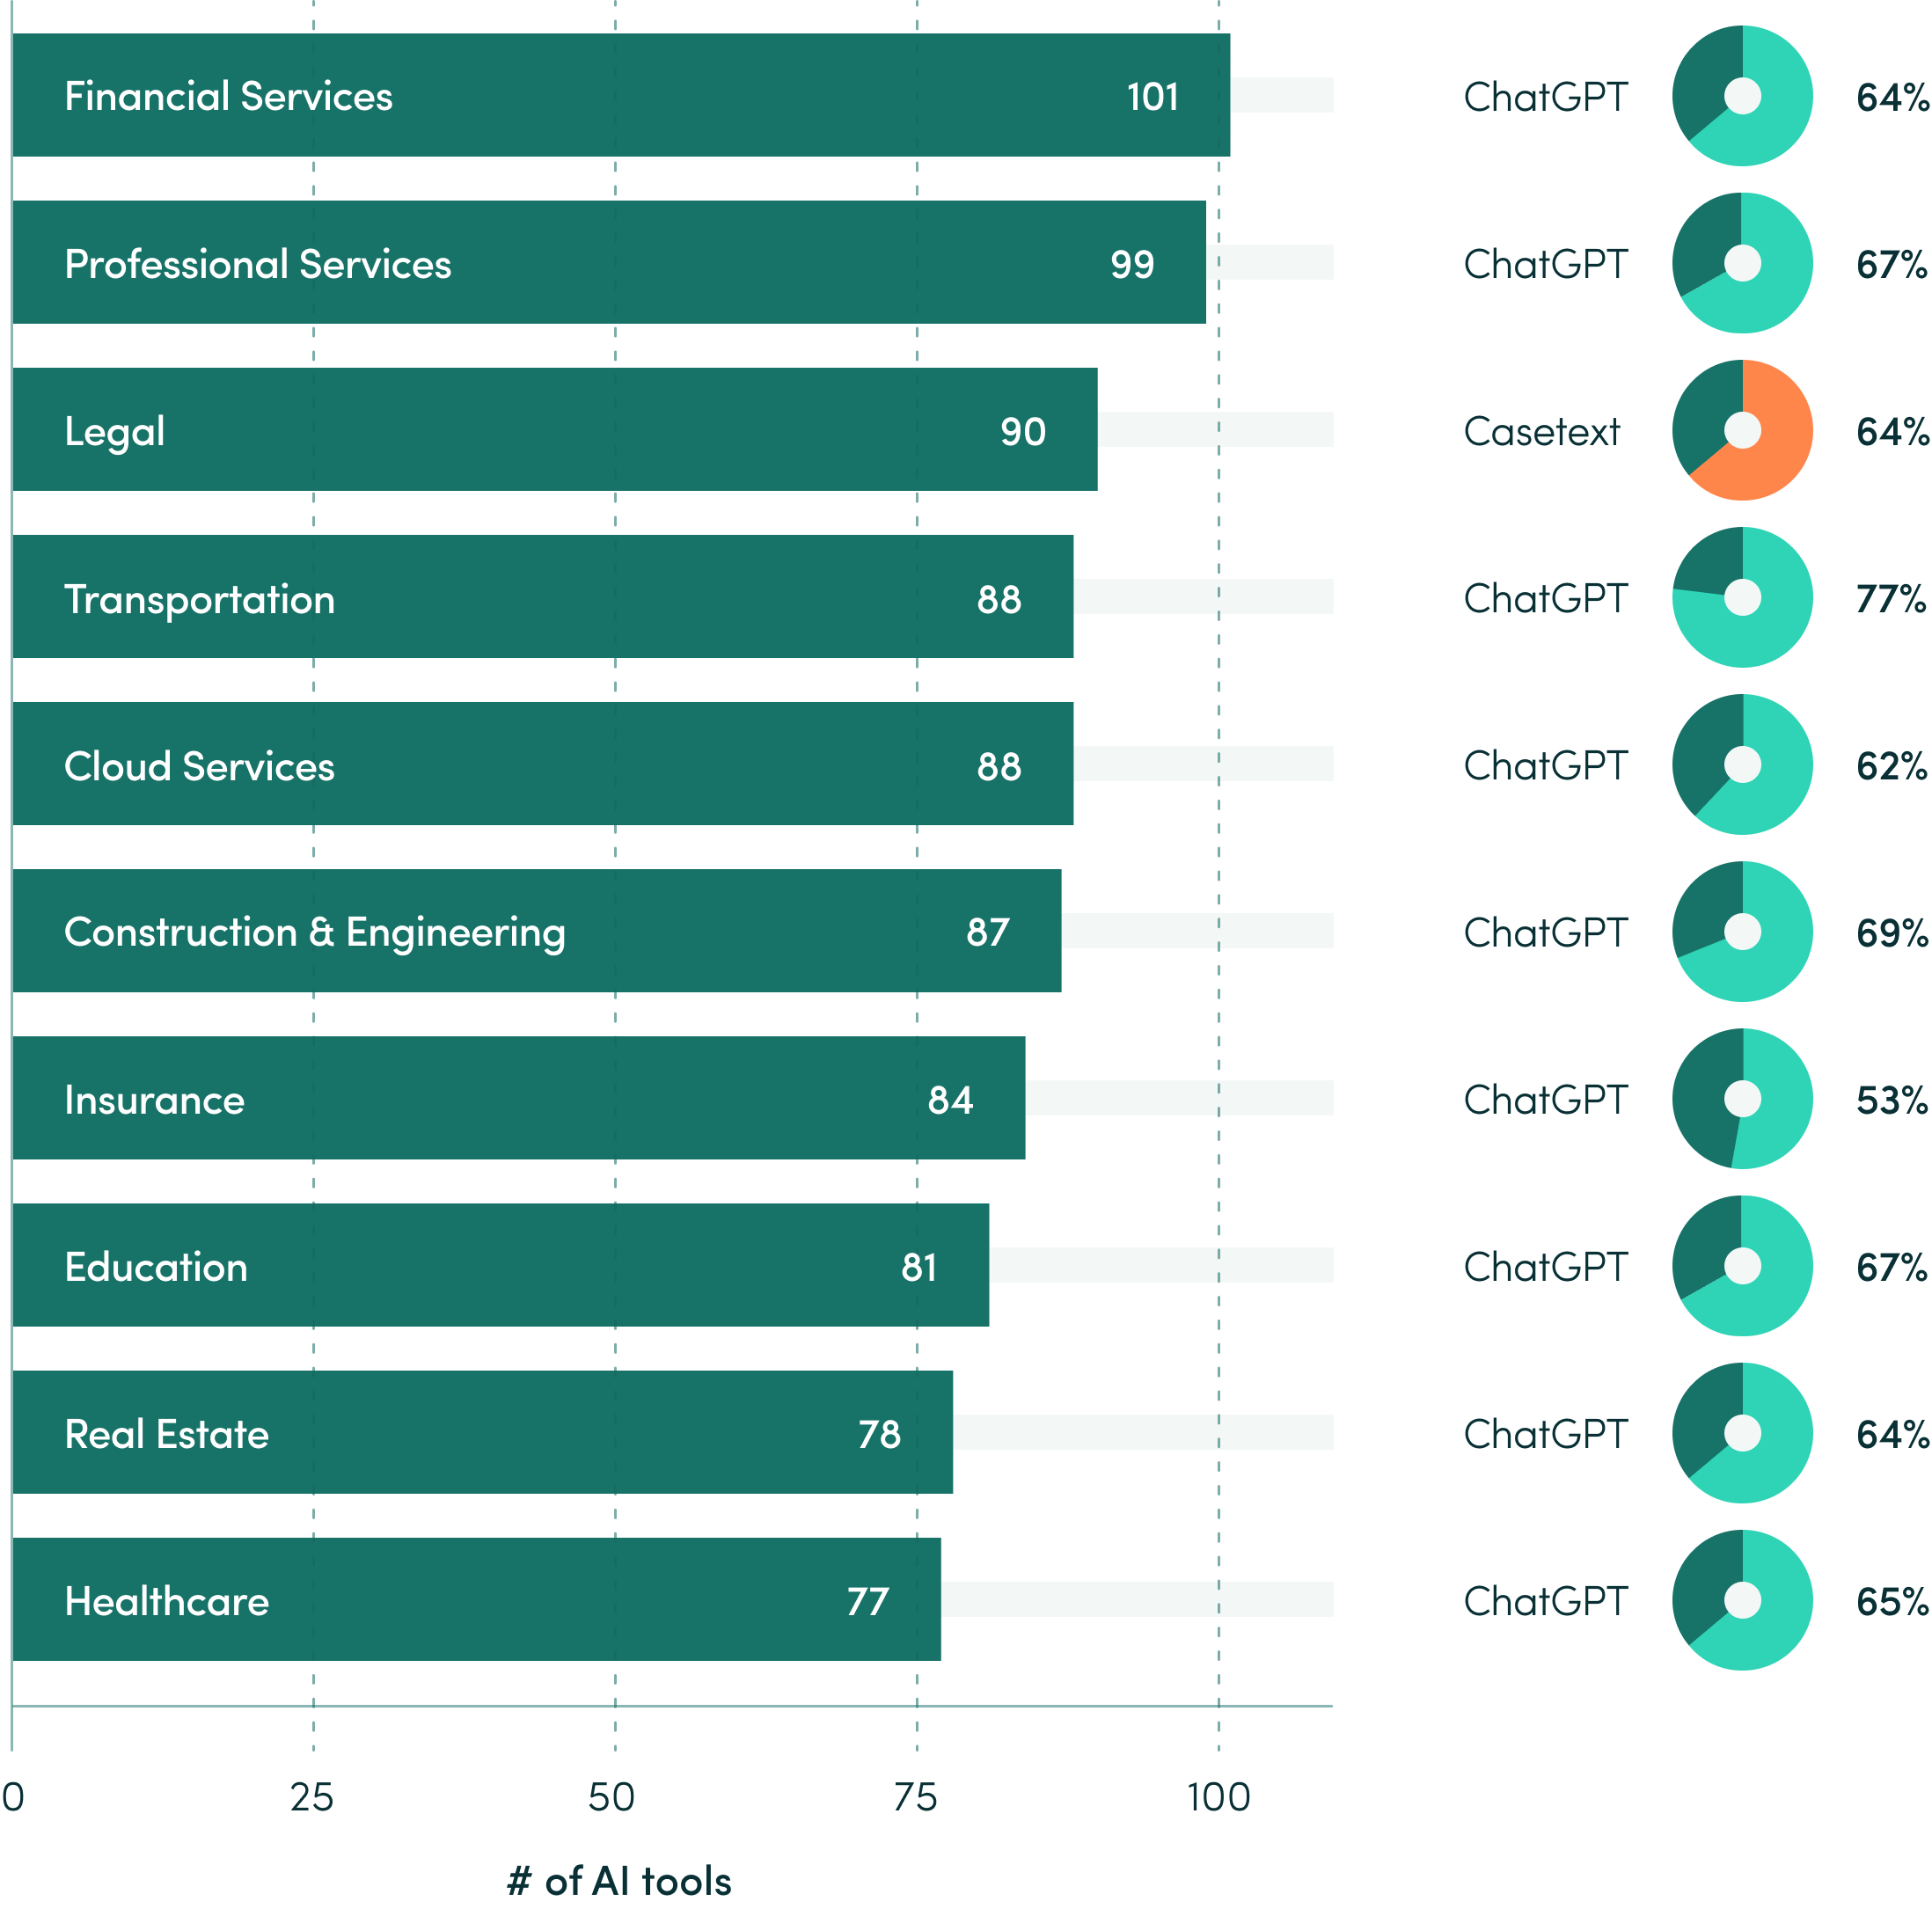
Factors such as industry, company size and workplace environment influenced AI tool adoption (continued).
- The top 3 AI tools used across the top 5 industries are ChatGPT, Casetext and Quillbot (Professional Services also includes Gemini, tied with Quillbot).
- Financial Services used the most AI tools.
- ChatGPT was the most used tool in all but one industry (Legal).
Top 10 industries by # of AI tools
TECH: AI ADOPTION
Lab Guidance
- Find the right balance: Train employees on effective AI use without solely relying on it, and provide training and support to ensure appropriate implementation.
- Promote a culture of experimentation and learning: Encourage employees to try new approaches, share best practices and learnings. Offer guidance to ensure AI usage aligns with organizational goals.
- Protect sensitive information: Exercise caution when sharing data with large language models (LLM), safeguarding company secrets and personally identifiable information (PII) from exposure.
Resources
According to a Forbes’ Advisor Study, 64% of businesses believe that artificial intelligence will help increase their overall productivity.
Per Cisco’s AI Readiness Index, only 14% of global businesses are fully prepared to deploy and leverage AI.
Salesforce research reveals, 79% of global workers do not have clearly defined policies for using AI for work.
Lab Conclusions
Productivity
Digital activity remained stable, but productivity declined later in the year. Transferring best practices from earlier months can boost productivity and yield significant gains.
Engagement
Fewer employees maintained a healthy workload balance, leading to increased disengagement. Sustain effective burnout reduction programs and redirect resources to support targeted training and growth opportunities.
Tech: AI Adoption
One in five employees used AI tools in 2023. We expect this trend to continue, driving the need to have clearly defined policies around appropriate use to maximize the benefits of emerging technology.
Glossary
Burnout
Employees at risk spend >75% in an overutilized state annually.
Capacity
Total number of productive hours worked as a percentage of expected productive hours.
Collaboration
Working time that occurs through two-way communication using digital collaboration tools like meeting software, and chat and messaging applications.
Disengagement
Employees at risk spend >75% in an underutilized state annually.
Efficiency
The percentage of productive, focus or collaboration time relative to total time.
Focus
Working time when an employee is engaged in a single task without interruptions, attention shifts or collaborative activities.
Focus Session
The average time employees operate without multitasking (interruptions or attention shifts) and collaboration activities.
Healthy Utilization
When an employee is within +/-% threshold of their daily productive hours goal.
Multitasking
Working time spent in productive applications that consists of general administrative business tasks with attention shifts.
Overutilization
When an employee is more than X% over their daily productive hours goal (percentage goal set by employer).
Productive Session
The average time employees operate without unproductive disruption. This is calculated by counting the number of non-business activities per total hours.
Productive Time
Time spent engaging with productive apps and sites that includes focused, collaboration and multitasking activities.
Total Time
The average time an employee spends on a computer screen.
Underutilization
When an employee is more than X% under their daily productive hours goal (percentage goal set by employer).
Unused Capacity
Equal to expected productive hours/day minus actual productive hours/day (default for calculations is 7 hours). When expressed as a percentage, user capacity + unused user capacity will equal 100%.
Utilization
A measure of employee engagement and well-being based on average productive hours/day relative to the goal set for their team.
Weekend Work
Two or more hours on at least one weekend day.
Workday Span
Time between the first and last activity reported on an employee’s computer.
Methodology
This report is based on quantitative data collected via ActivTrak’s workforce analytics platform. It reflects actual user behavior recorded between January 1, 2021 and December 18, 2023 through a uniquely coded intelligent agent network. To better understand a range of employee experiences, this report leverages two data sets. Unless noted, Data Set A was used.
Data Sets
Primary Data Sample (A)
# companies
958
# users
135,098
# hours analyzed
96,912,446
Single Time Zone Data Sample (B)
# companies
737
# users
49,194
Customer Data Privacy
ActivTrak has the right to use, store, disclose, transfer, exploit, collect, develop, create, extract, compile, synthesize, analyze and commercialize all information, data, statistics and other content derived from Aggregated Data (collectively, “Blind Data”). Blind Data will be owned solely by ActivTrak and may be used for any lawful business purpose without a duty of accounting to Customer. “Aggregated Data” means Customer Data that is: (i) anonymized and not identifiable to any person or entity; (ii) combined with the data of other customers or additional data sources; and (iii) presented in a way which does not reveal Customer’s identity.