This is the final article in a three-part series focused on workforce analytics and the new approaches organizations can take to drive employee productivity in the evolving workplace.
In Part I, we introduced what workforce analytics is and how it helps measure employee productivity with user activity data. We also offered potential use cases for the data insights to demonstrate how to better understand employee productivity.
In Part II, we introduced a new framework for productivity using insights from workforce analytics software, outlining six tenets organizations can use to get insights into specific productivity areas. We explored the first three: employee engagement, work alignment, and focus levels.
In this final part III of the series, we will finish outlining the framework and dive into the last three productivity tenets: performance, friction and well-being.
Measuring Employee Performance Behaviors
Performance and the mere mention of it can conjure up anxiety in some professionals and confidence in others. Measuring worker performance may include some kind of grading scale, quarterly target goals or KPIs that have been set. Often, these are set early on and not visited regularly, typically until a quarter ends and business results have been tallied. It’s not uncommon for many employees to have no idea how they are performing along the way, that is, unless they are under-performing. As the saying goes, no news is good news.
Often, if you ask employees if they are performing well at work, most will nod their heads yes yet are not really sure where they stand with regards to stated goals or how their performance compares to others. This seems puzzling given most of us want to know how our performance is evaluated and want to be recognized or rewarded for our achievements. It’s like an unspoken disconnect more common in organizations than not. According to a recent article by Harvard Business Review, this is the result of an over-reliance by managers and employees alike of counting hours worked and “Face time together in the office as markers for effort. With the advent of technology and the ability to work remotely, being connected and responsive at all hours is the new face time.” .
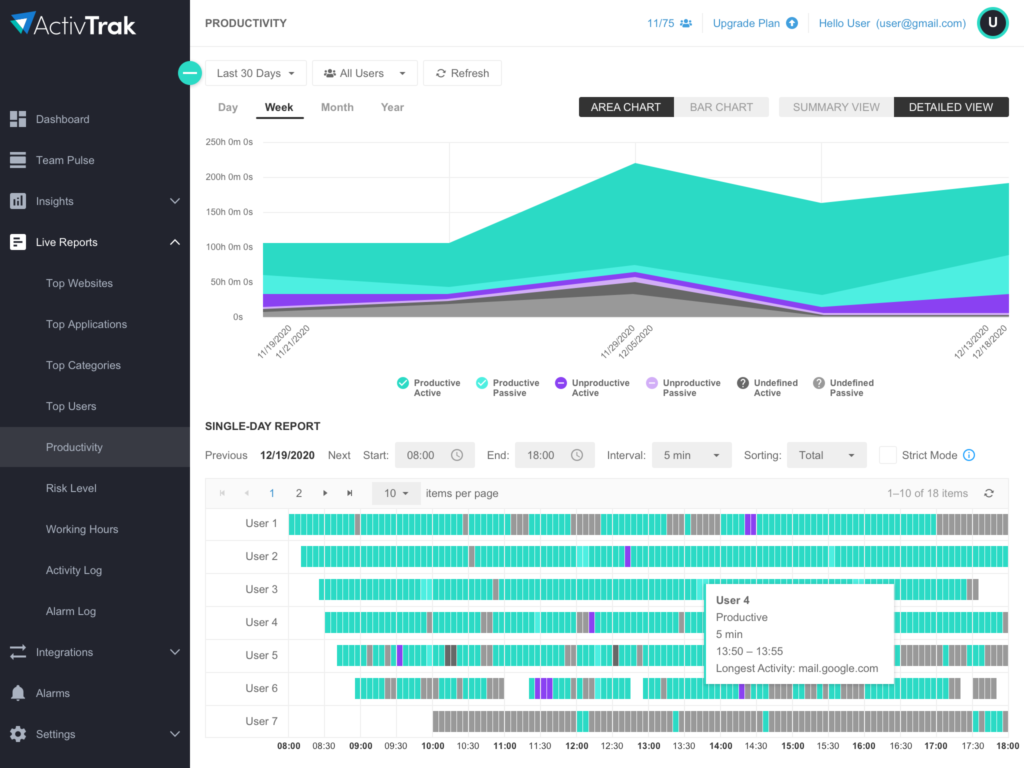
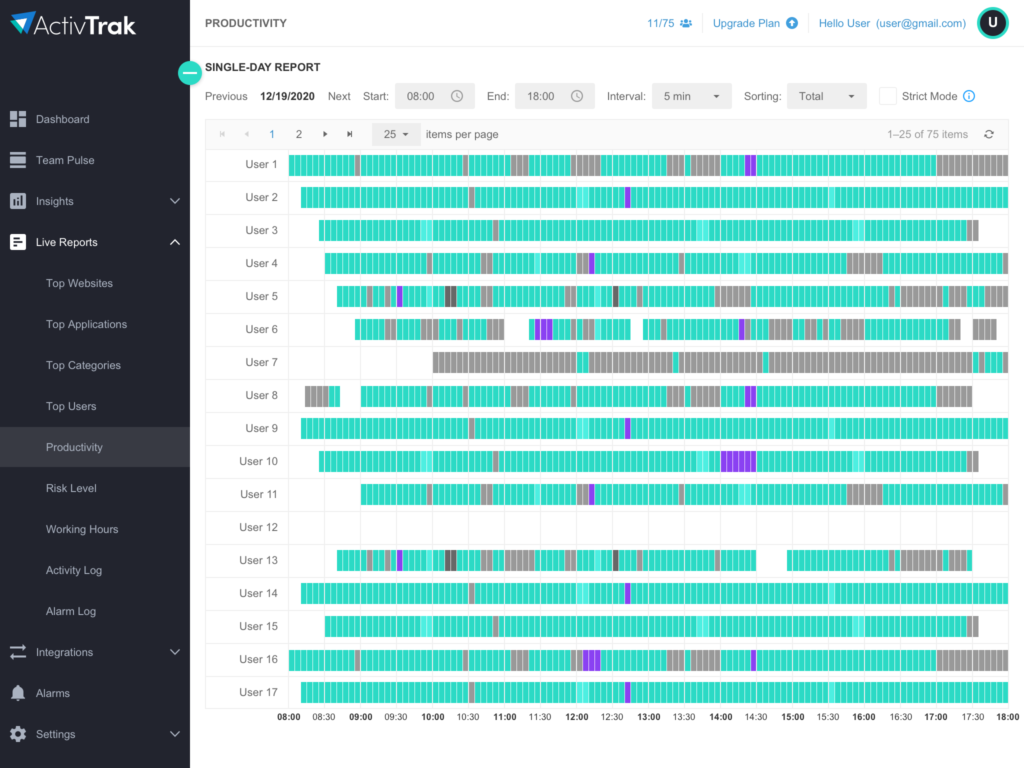
Workforce Analytics can solve for this vast disconnect by providing an on-demand glance into employee performance both individually and across teams. By on-demand, we mean across time horizons including a specific week, month, quarter or even year. The dashboards within workforce analytics software provide visibility into performance trends including comparisons to benchmarks. This is helpful to not only highlight top performers, but also to identify success patterns that can be replicated across teams, helping all employees improve performance.
Workforce analytics provide key insights such as:
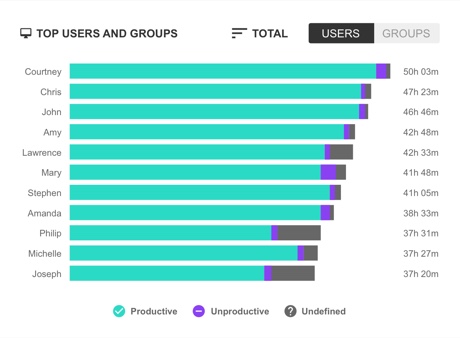
- Leaderboards: Who are the top productive members of the team and what is the team average?
- Top Productivity Trends: Top users’ activity trends week-over-week to gauge individual, as well as team performance.
- Benchmarks: Establish benchmarks for average productivity across your team so you can have an objective measure for the performance of each team member in a given week, month, or other custom timeframe.
Discovering Areas of Friction
Employees whose performances are struggling, can experience severe stress. If left unchecked, the stress can cause a downward spiral in effort and motivation. But it doesn’t stop there. According to Gallup, employee disengagement results in 37% higher absenteeism, an 18% reduction in productivity, and a 15% decrease in overall organizational profitability.
Workforce analytics software can help business leaders pinpoint the causes of employee disengagement, preventing costly consequences before they occur. How? By analyzing the dashboards and reports, it may become clear that there are areas of friction preventing workers from doing their jobs effectively. Some employees simply don’t know how to “get around the system” while others have figured out how. These friction points could come in the form of inefficient business processes, poorly performing applications that slow things down and/or unnecessary overlap in roles and tasks across team members. It can be a challenge to uncover exactly what might be in the way without a workforce analytics tool and the data insights provided within.
Using analytic dashboards, employers gain visibility into key areas of the business ripe for optimizations such as:
- Do employees have the right tools for their roles?
- Do they spend too much time searching for information to do their jobs?
- Do they use the internal knowledge base or “go around” the system?
- Who might be spending too much time in meetings?
- Are collaboration tools effective or distracting?
Identifying Employee Burnout & Promoting Well-Being
Employee burnout can sound like a buzzword, but there’s increasing evidence of the toll it takes on individuals and organizations alike. In fact, just last year, the World Health Organization (WHO) added burnout to it’s International Classification of Diseases, defining it as “a syndrome conceptualized as resulting from chronic workplace stress that has not been successfully managed.” Burnout from chronic stress has also proven to be costing billions of dollars each year in healthcare costs.
But there is no one-size-fits-all management strategy to prevent burnout and ensure healthy work habits within an organization. Some employees thrive in fast-paced environments and pride themselves on putting in long hours while others prefer a slower pace with more focused work projects. An important thing to remember when looking at these differences is understanding the lens you use and the employee you’re evaluating Just because an employee is working harder and faster, doesn’t mean they are effective. Admittedly, this tenet requires a level of soft skills and observation on the part of the manager to look for signs of stress or overworking. However, workforce analytics can provide data insights that can help jumpstart and frame your conversations about workloads and healthy work practices.
Workforce analytics can help predict burnout by highlighting the signs of burnout using data, benchmarks, and comparisons to peers. We aren’t talking about productivity or performance benchmarks this time, but rather aggregating data points such as total hours worked, time spent working outside of normal working hours including nights and weekends. Managers can also review a Break Time report to analyze trends of user activity related to taking breaks or lack thereof. Managers can also easily view patterns where there is or isn’t a healthy balance between work time and break/rest time across team members.
By using workforce analytics, you’ll have insights to facilitate important discussions including:
- Benchmarks for common hours worked and thresholds across teams
- Team members on the verge of, or already showing, a high risk of burnout
- Break time and rest time patterns across individuals and teams
The time for a more evolved approach to measuring performance, removing friction, and preventing burnout is now. Workforce analytics help meet the growing and business-critical demands of organizations to improve knowledge work. Utilizing workforce analytics software can offer a framework for better insights into key workforce productivity areas including work alignment, focus levels, engagement, performance, friction and well-being.
Get Free Workforce Analytics with ActivTrak!
ActivTrak is an approachable workforce analytics software that can give you a whole new level of understanding regarding your workforce’s productivity that can benefit both employees and employers alike. Unlock key, actionable insights by starting a free account today (no credit card required).
Already Have an ActivTrak Account?
Take your analysis to the next level with ActivConnect, an add-on available for Advanced Plan accounts. Easily combine and visualize your ActivTrak user activity data with other key business data from BI tools such as Tableau, Power BI, Google Data Studio, and more. See what it can do for you by requesting a demo.
About ActivTrak
ActivTrak is a workforce productivity and analytics software company that helps teams understand how people work, whether in-office or remote. Our cloud-based user activity monitoring platform collects and analyzes data and provides insights to help organizations be more productive and compliant. With more than 8,000 customers and over 250,000 users of its free version, ActivTrak’s award-winning solution can be configured in minutes to identify operational bottlenecks, flag operational compliance risks, and provide valuable insights that help employees and employers improve productivity outcomes.