User Activity Report!
We have a new report! While sifting through your Top Applications and Top Websites reports, you now have the ability to drill down into the specific website or application and view which user used which application, and when they used it, and for how long.

You’ll notice this is a much more visual representation of your data, with different colors indicating more or less time spent in the program, and when you hover over a block of time you’ll see more details such as the exact amount of time spent in the application.

Click a slice of the Top Apps/Websites widget from your dashboard to go directly to this report and begin investigating who was using what and for how long. Alternatively, click ‘Users’ while inside the Top Websites/Apps report on the website or application that you want to explore.
Export to Google
Use Google tools? Your life just got a lot easier.
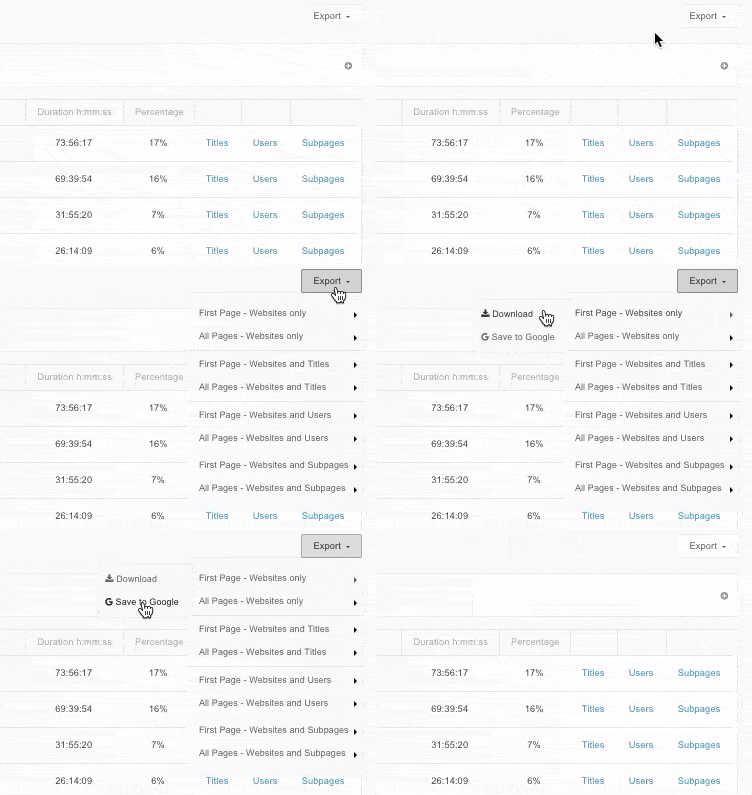
You can now export and manipulate all reports and screenshots to your google account. All exports will create their own ‘ActivTrak’ folder in your Google Drive to house your exported data.

Now, when you go to export a report, you’ll choose what data you’d like to export (this page vs. all pages, etc…), but now you’ll notice two options appear next the drop-down labeled ‘Download’ and ‘Google.’ Simply choose the option you prefer, and you’ll have your ActivTrak data in your possession in no-time.
 You’ll notice this is a much more visual representation of your data, with different colors indicating more or less time spent in the program, and when you hover over a block of time you’ll see more details such as the exact amount of time spent in the application.
 Click a slice of the Top Apps/Websites widget from your dashboard to go directly to this report and begin investigating who was using what and for how long. Alternatively, click ‘Users’ while inside the Top Websites/Apps report on the website or application that you want to explore.
 Now, when you go to export a report, you’ll choose what data you’d like to export (this page vs. all pages, etc…), but now you’ll notice two options appear next the drop-down labeled ‘Download’ and ‘Google.’ Simply choose the option you prefer, and you’ll have your ActivTrak data in your possession in no-time.
