AI changes how work gets done. Few organizations know where it creates business value.
- Where should we invest in AI?
- Where can work move faster?
- Do we have the right workforce capacity?
- Where does AI create measurable value?
- Which work should we automate next?
- Which technology investments are paying off?
One platform. Four ways to improve business performance.
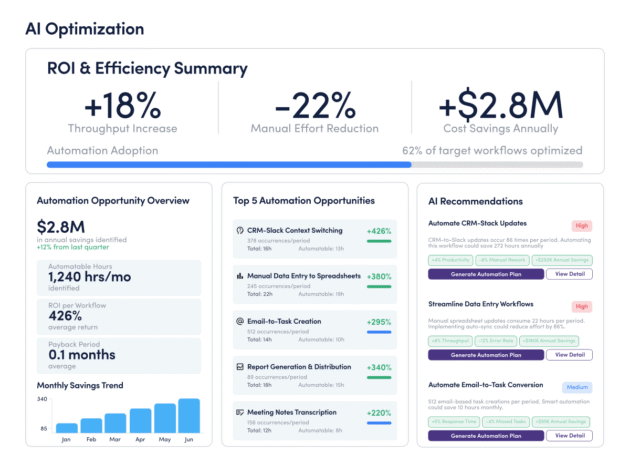
AI Optimization
Turn AI adoption into measurable business impact.
Track adoption, quantify productivity impact and identify where AI improves workflows, capacity and business performance.
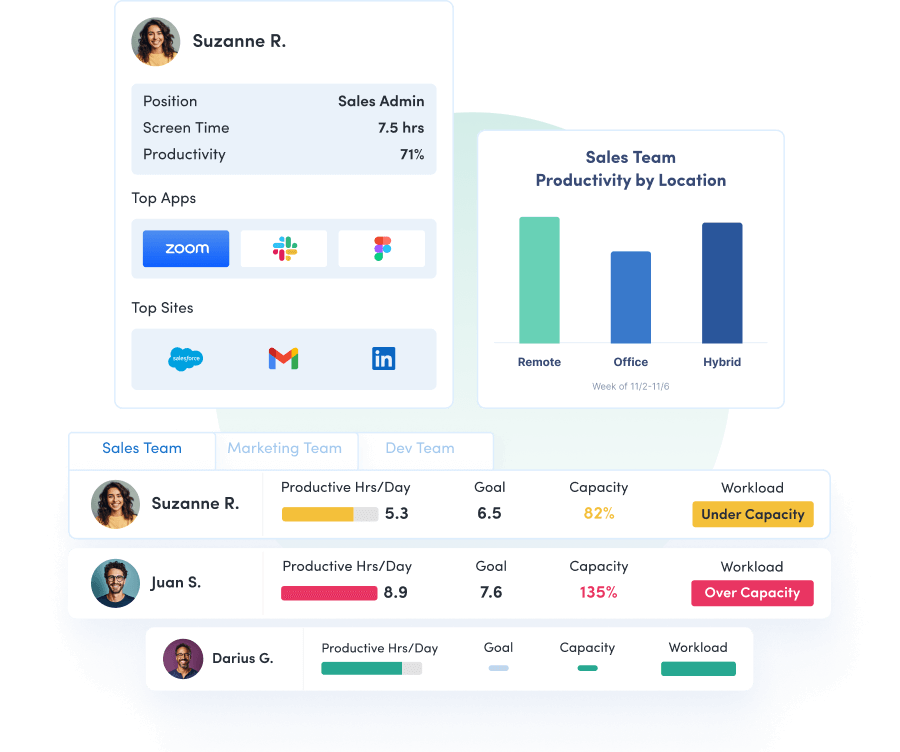
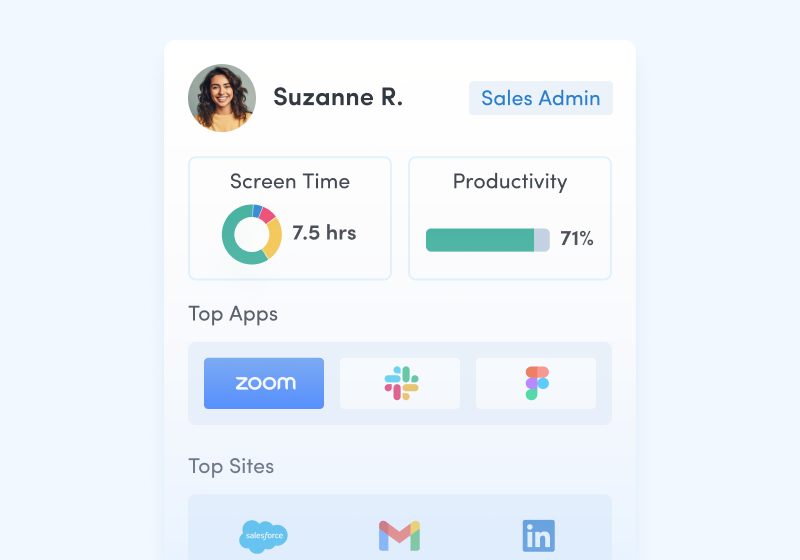
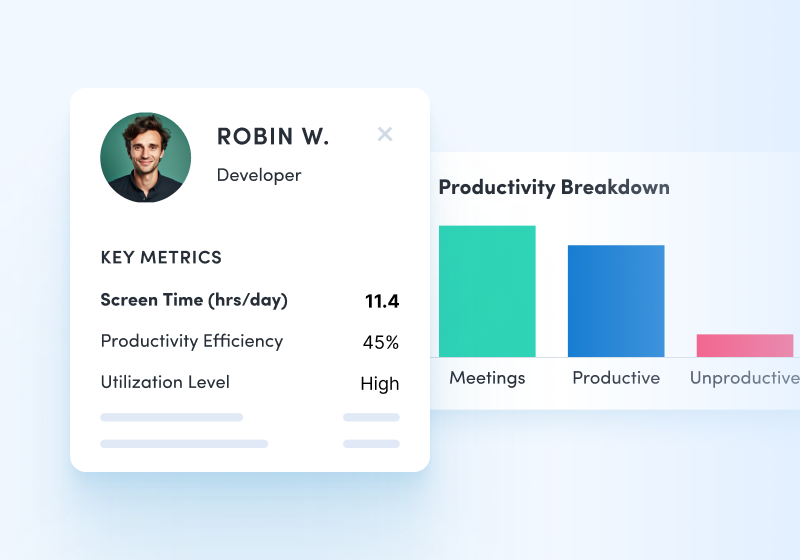
Productivity Optimization
Increase output without increasing headcount.
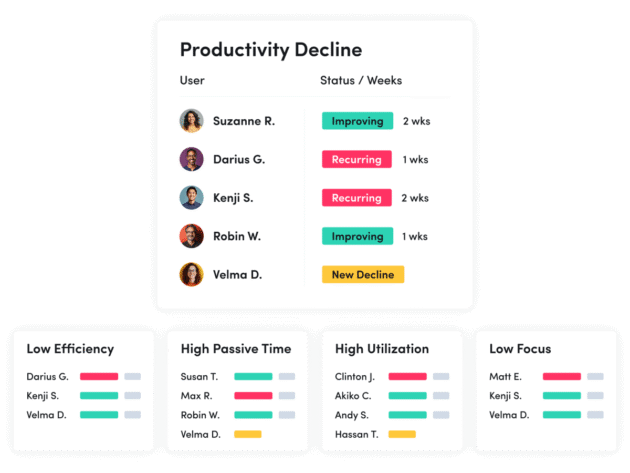
Identify bottlenecks, reduce low-value work and help teams spend more time on activities that drive business results.
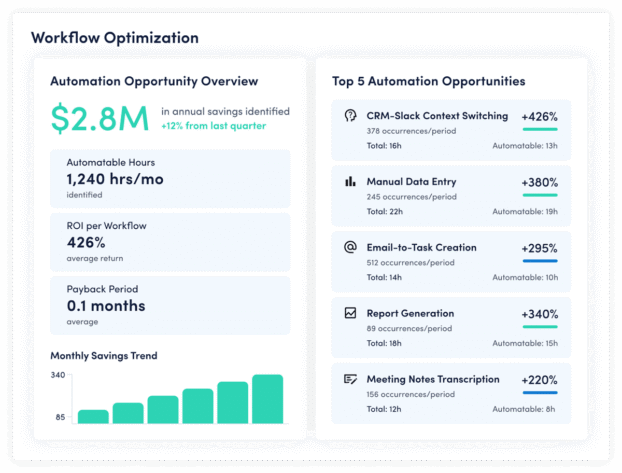
Workflow Optimization
Optimize the way work flows across your business.
Understand how work actually flows across your organization so you can eliminate bottlenecks, automate repetitive tasks and continuously improve how work gets done.
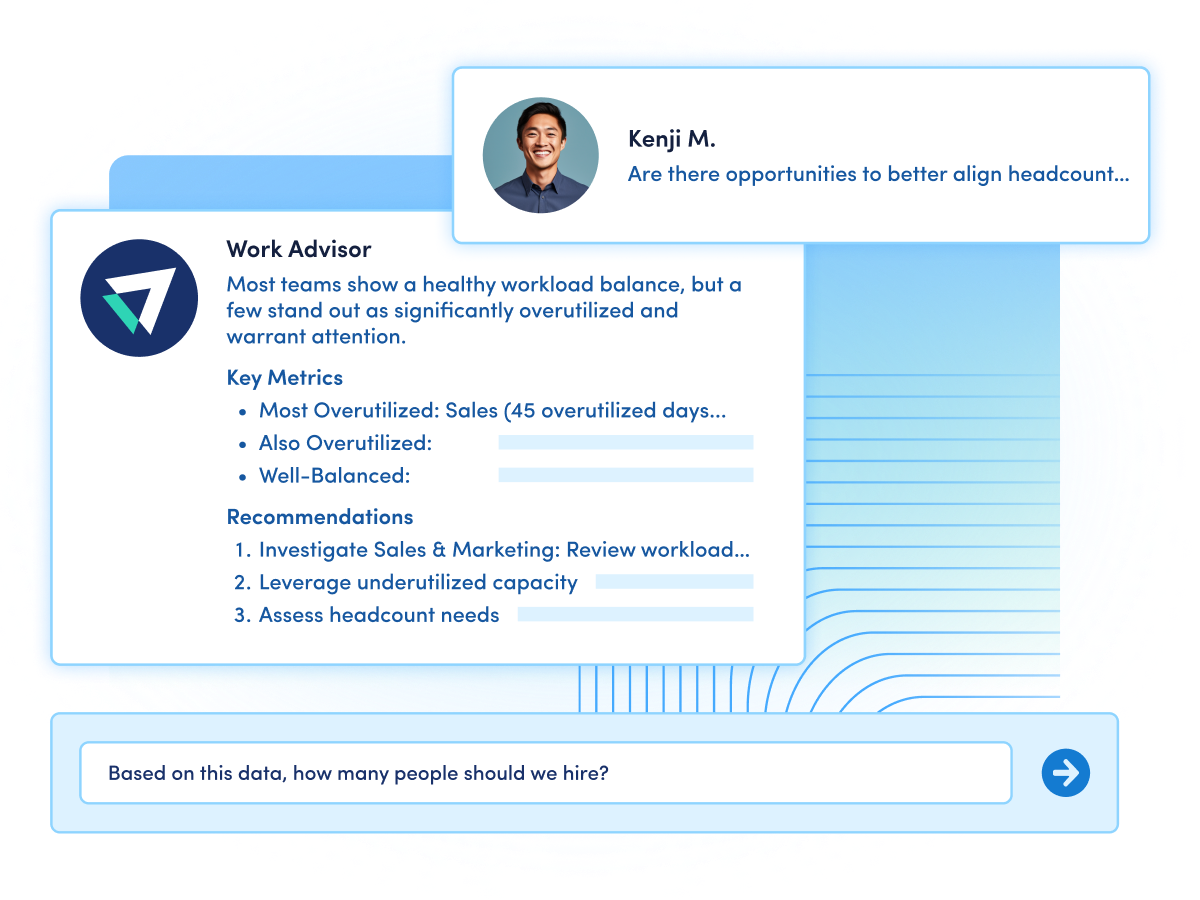
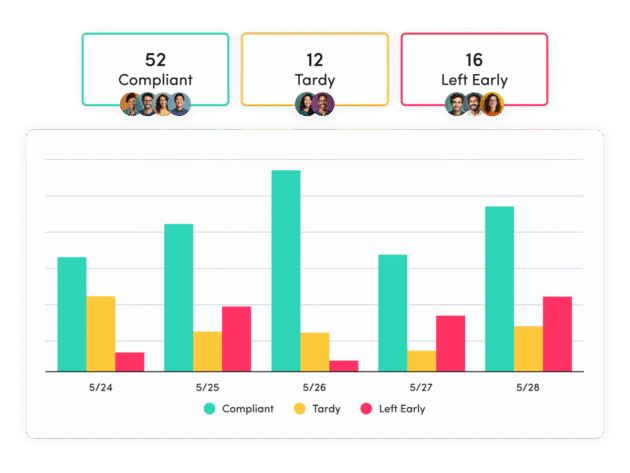
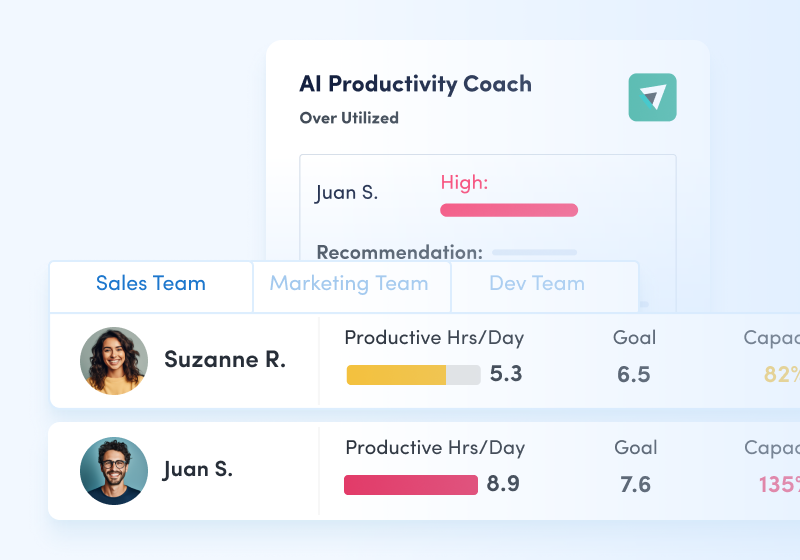
Workforce Optimization
Make better workforce investment decisions.
Optimize workforce capacity, balance workloads and make more informed staffing and resource decisions using trusted behavioral data.
CORE PRINCIPLES
Built on Work Observability. Powered by Work Intelligence.
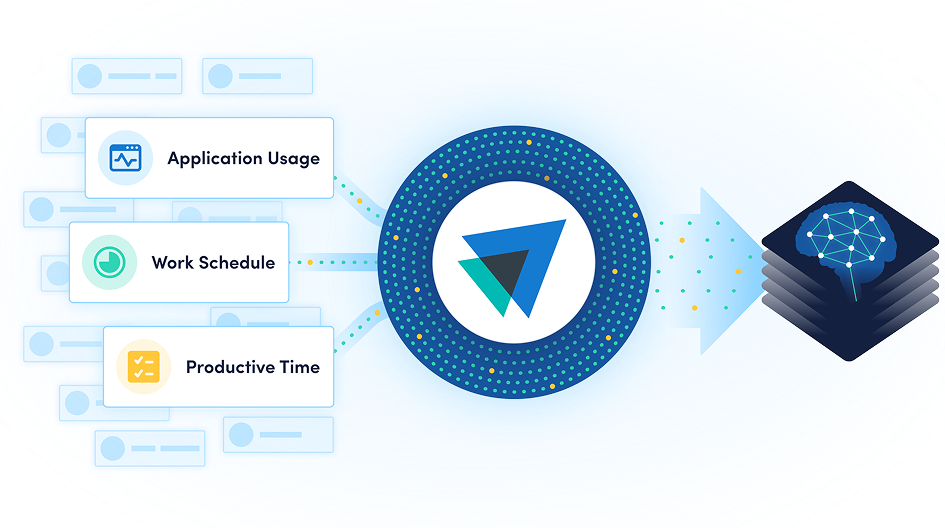
Work Observability captures behavioral work data across people, AI and technology — creating a continuous, cross-tool view of how work gets done.
Work Intelligence transforms those signals into actionable insights and recommendations that help leaders improve productivity, optimize workflows, identify automation opportunities and make smarter business decisions.
Universal Work Visibility
A complete view of work across applications, AI tools, meetings and workflows — not just within a single software ecosystem.
AI-Powered Intelligence
Transform behavioral work data into recommendations, contextual insights and benchmarks that help improve business performance.
Privacy by Design
Enterprise-grade privacy controls, configurable anonymization and a privacy-first approach to data collection that protect employee trust.
See work across the systems where it happens.
Connect ActivTrak with your workforce, business and AI systems to add organizational context, enrich analysis and deliver work intelligence where decisions are made.
Workday
ADP

Microsoft Teams
Outlook

Google Calendar
ServiceNow
Zendesk
ChatGPT
Claude
Gemini
Microsoft Viva
Jira Software
Salesforce
Slack
How It Works
Observe
Capture work signals across people, AI and technology.
Interpret
Transform behavioral data into contextual intelligence and benchmarks.
Improve
Optimize productivity, workflows, automation and workforce investments.
Proven business outcomes.
Parts ASAP
MedRisk
Echo Global Logistics