Show Hide Topic Menu
- Hybrid & Remote Workforce Management
- How it Works
- Learn Why
- What is Workforce Management?
- How To Unlock the Benefits of Remote Work
- 3 Key Hybrid & Remote Worker Monitoring Metrics
- Remote Work Monitoring Done Right
- Looking Toward The Future of Remote Work
- The Impact of Remote Work on Productivity Levels
- How to Manage Remote Workers with Success
- How to Overcome Common Remote Team Challenges
- How Implementing a Remote Work Policy Helps Employees Work Wiser
- Remote Workforce Technology to Maximize Productivity
Hybrid & remote workforce management software. For better visibility into how work gets done.
9,500+ global brands and organizations trust ActivTrak
Hybrid & remote workforce management software
ActivTrak delivers data-based insights for distributed teams
Manage performance across hybrid and remote teams with real-time employee data — no micromanagement or invasive techniques involved.
- Track productivity in real time
- See where employees perform best
- Understand how work gets done
- Keep teams accountable
- Catch issues as they occur
- Factor in offline work

“With ActivTrak, we have found opportunities to improve the level of engagement with remote staff without losing touch. This allows our management team to continue to focus on managing all staff with consistency and monitor application utilization levels.”
– C-Level Executive in IT
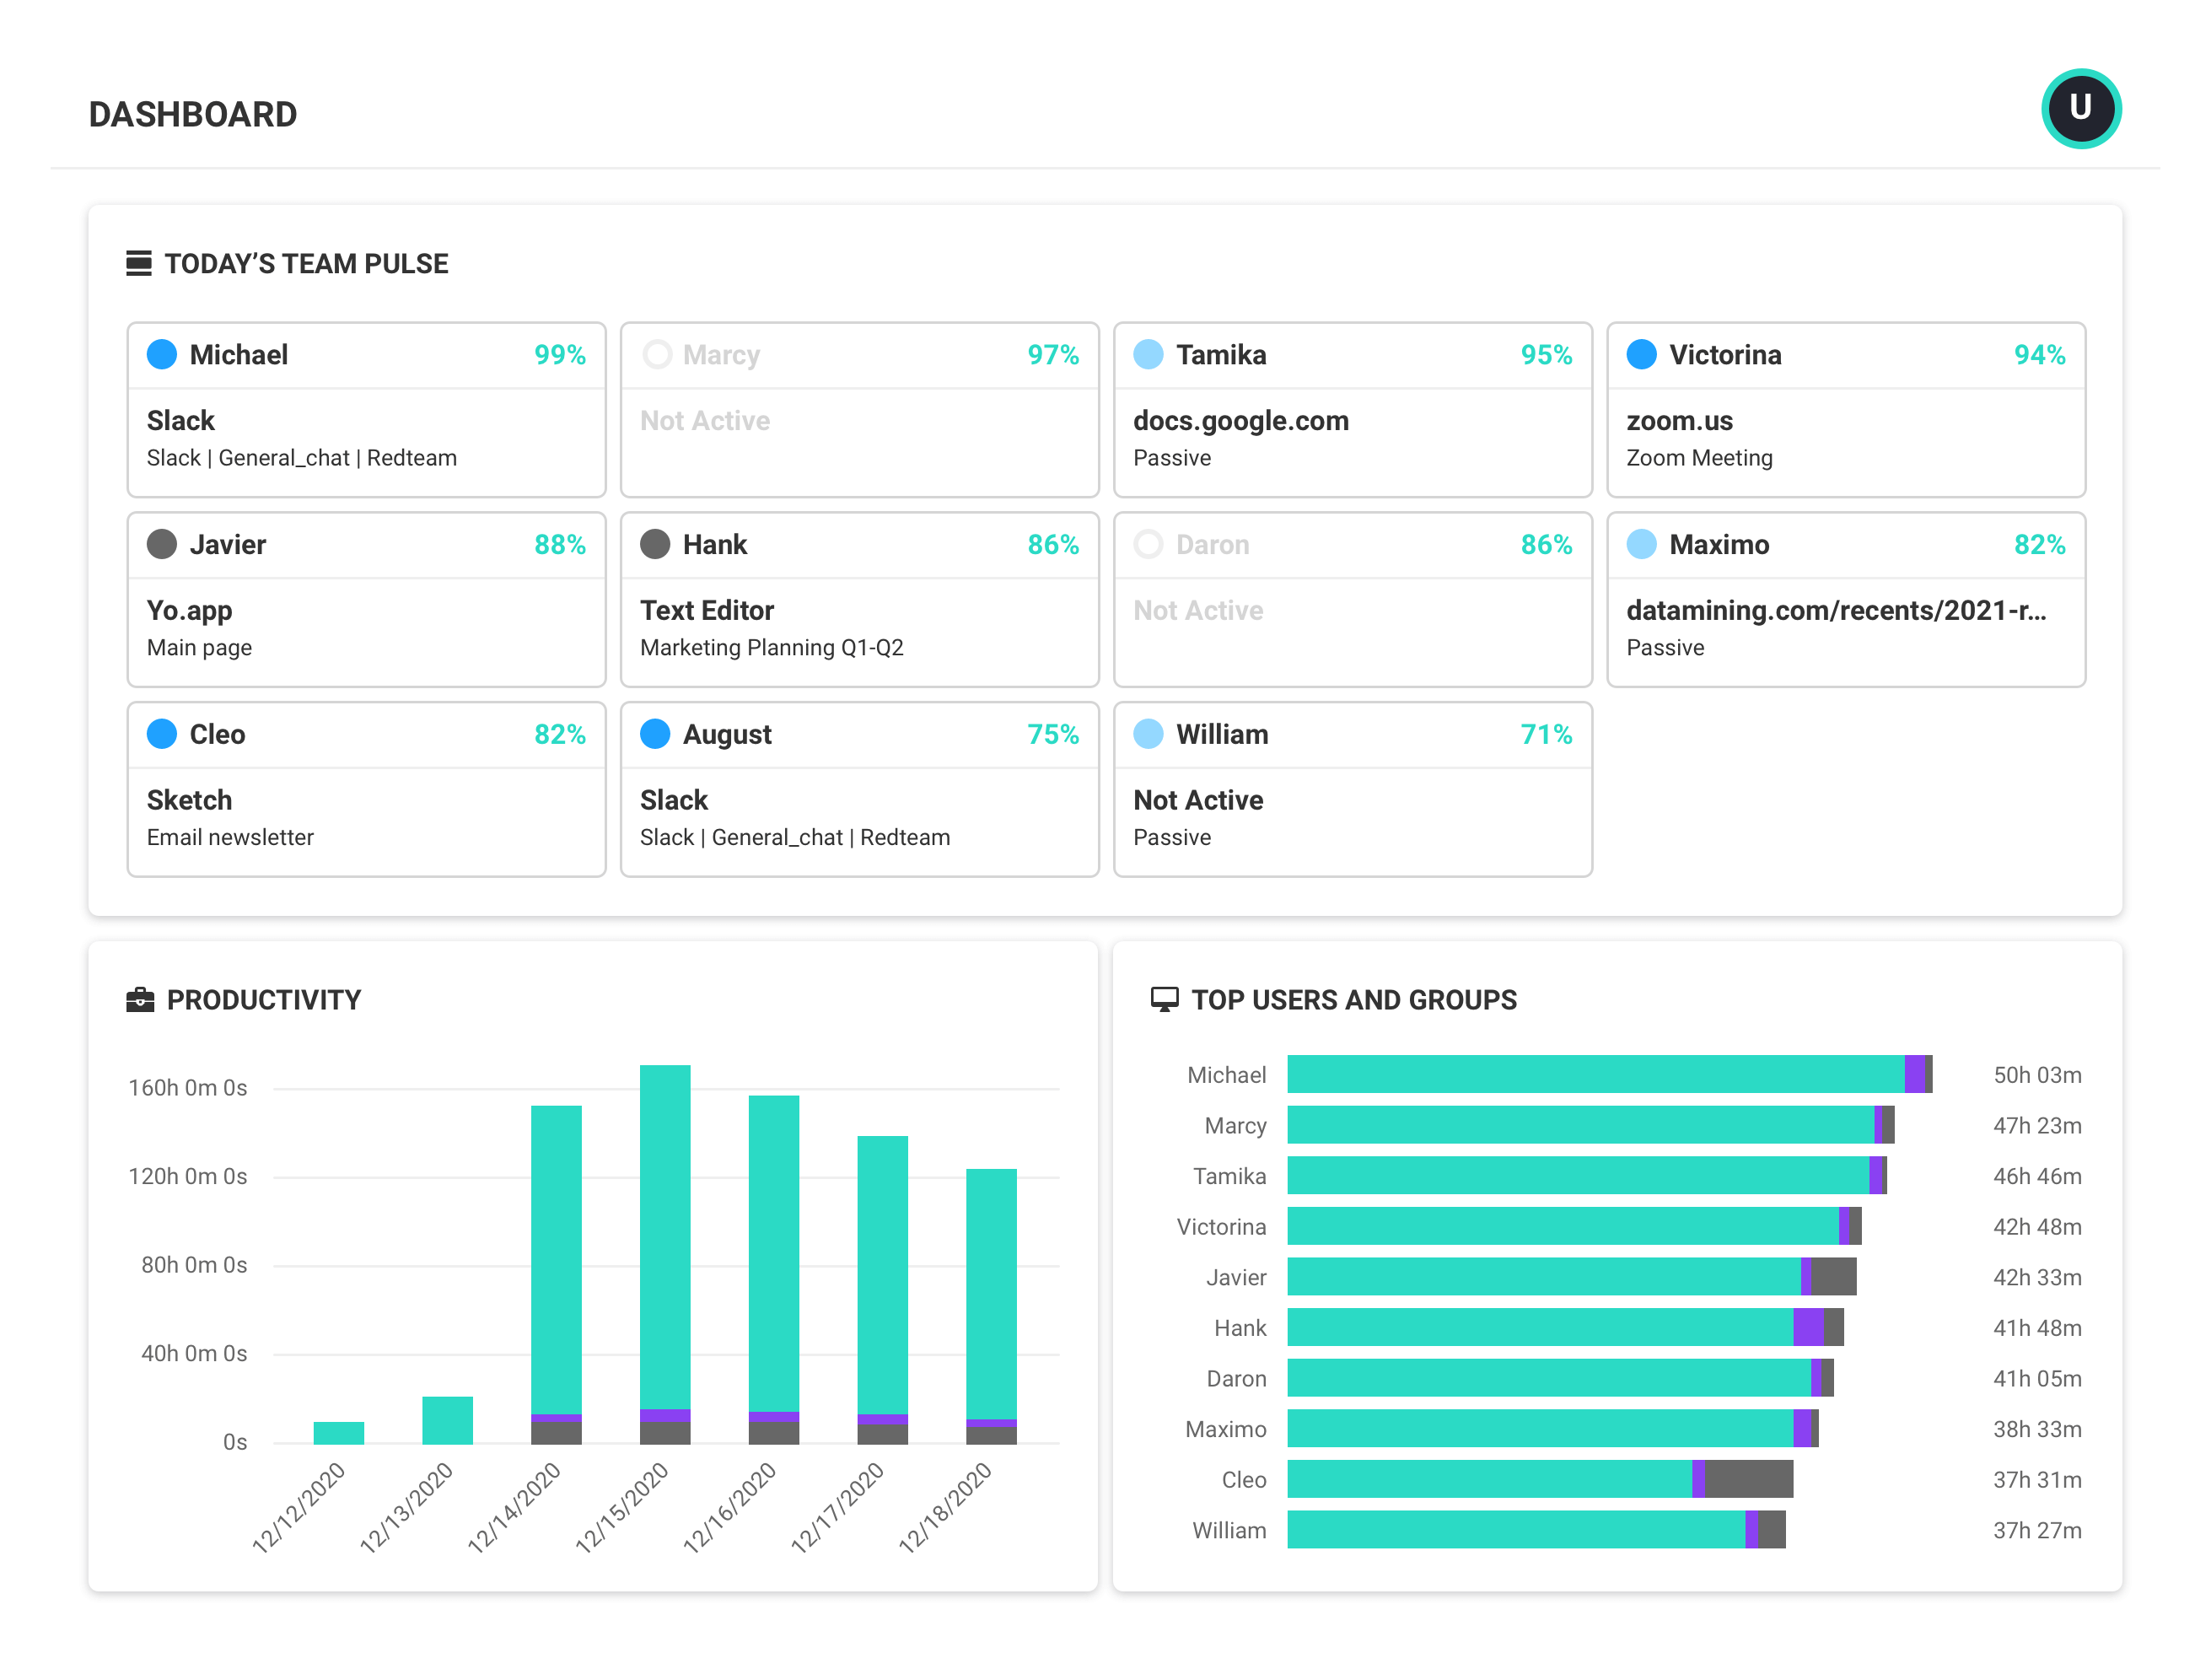
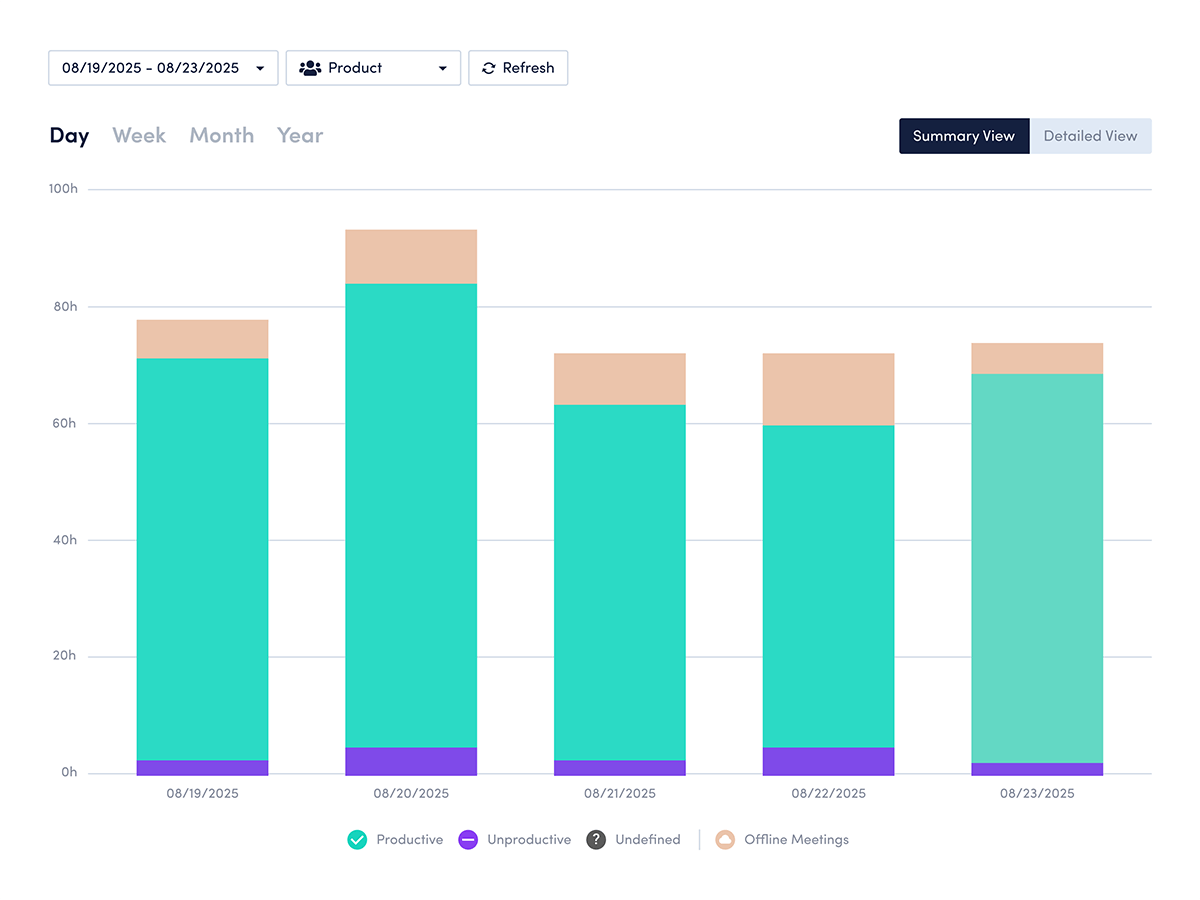
MONITORING & VISIBILITY
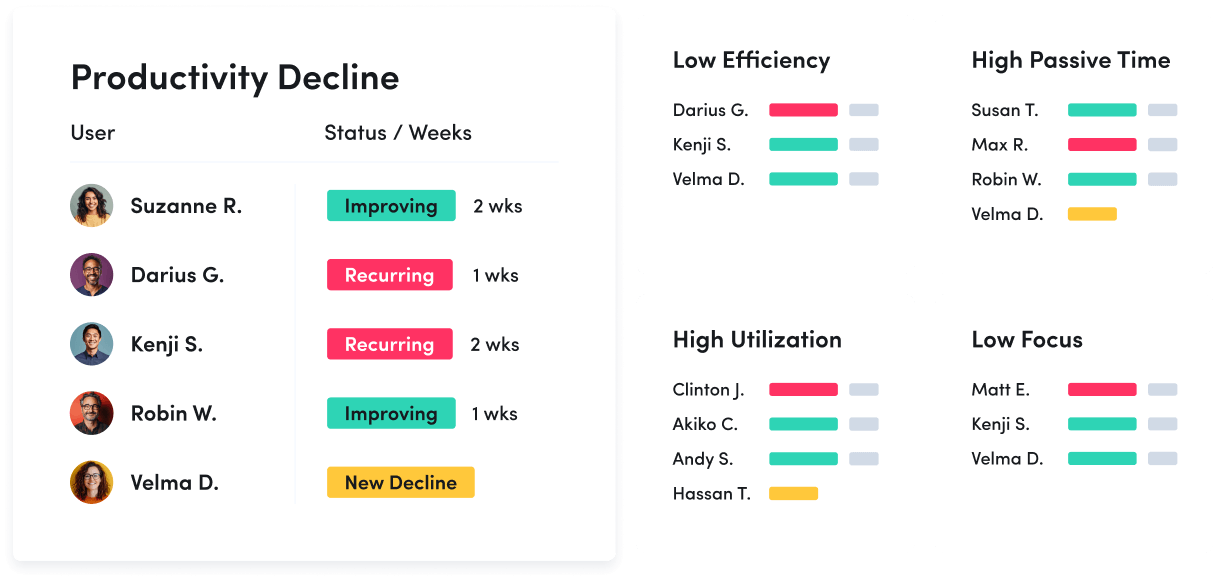
Track workforce productivity in real time
- Get instant visibility into how teams spend their time and across tasks and applications
- Understand daily productivity patterns and identify who may need coaching or support
- Analyze data by day, week or month to spot trends and rebalance resources proactively

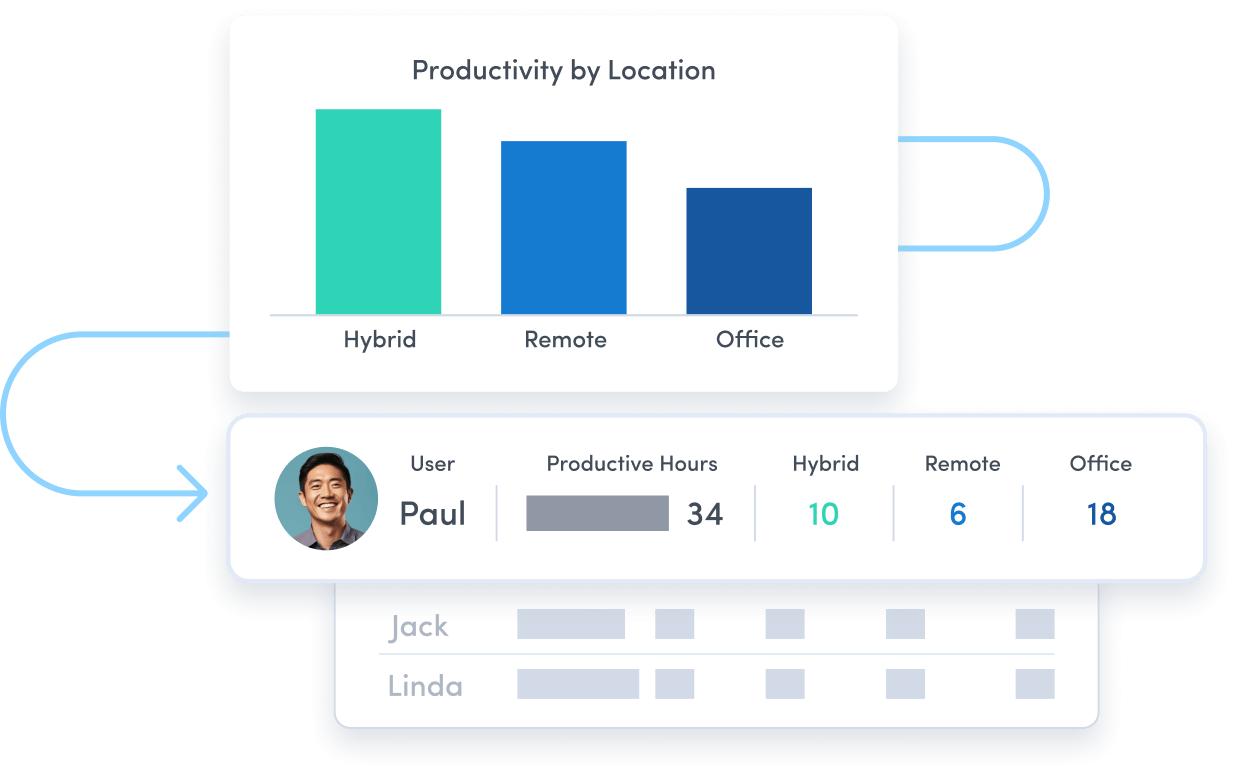
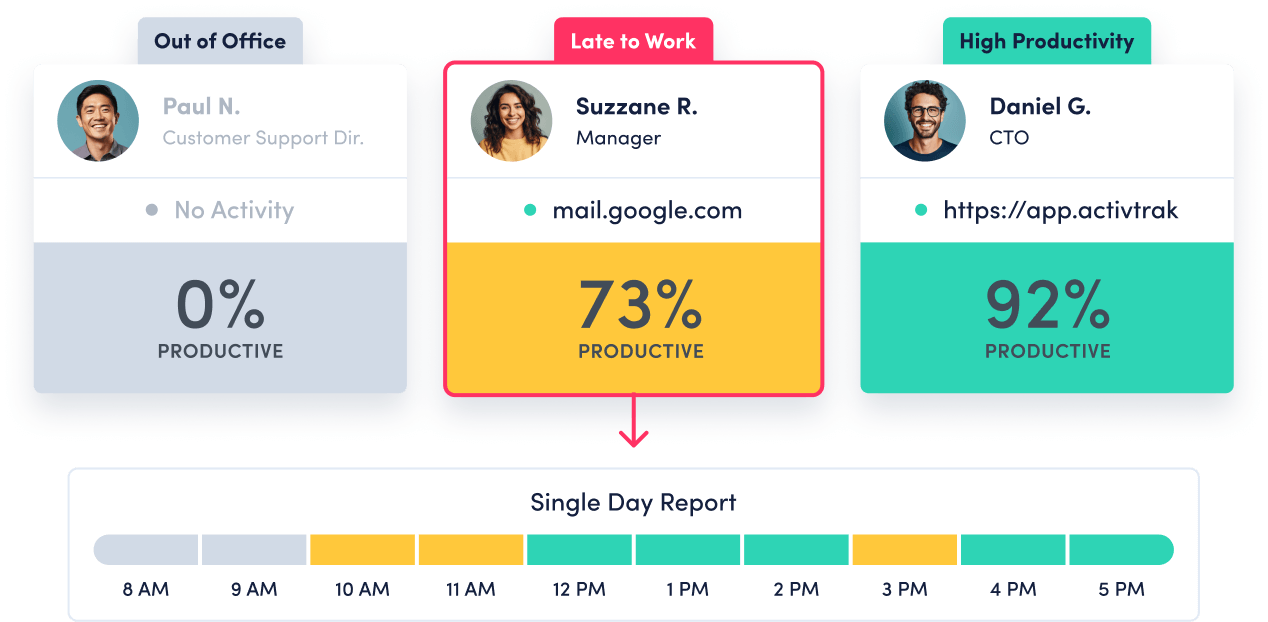
LOCATION ADHERENCE
See where employees perform best
- Compare productivity across remote, office and hybrid locations
- Use real-time data to guide policies and resource investments
- Monitor compliance without GPS or personal device tracking
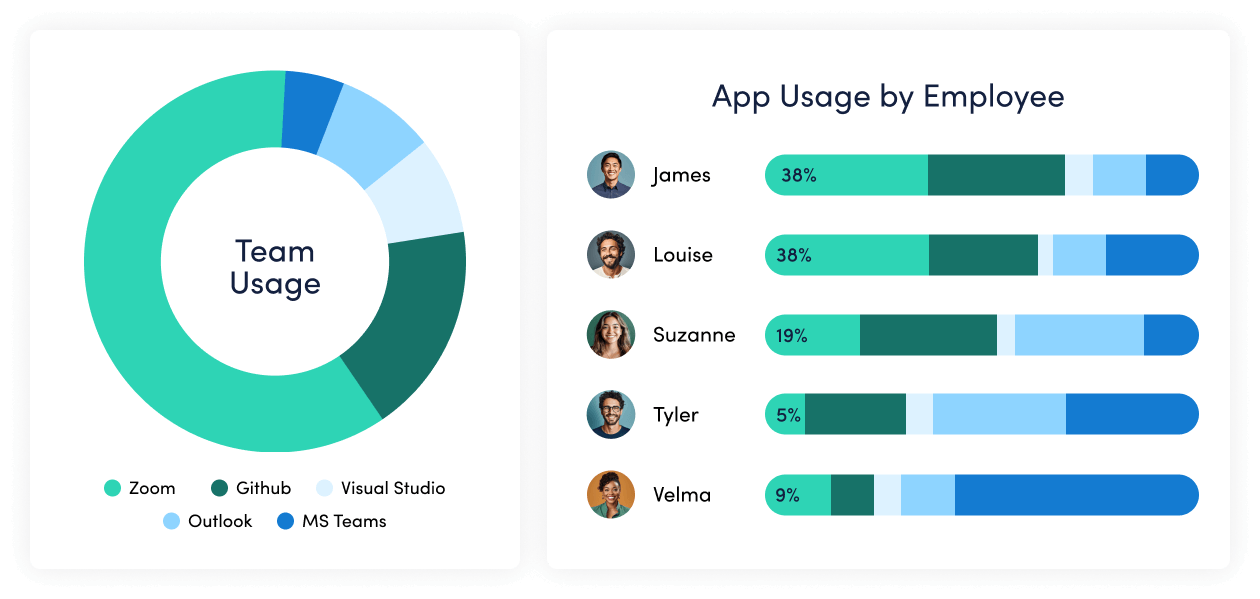
ACTIVITY CLASSIFICATION
Understand how work gets done
- Track which websites employees visit, and for how long
- Identify what apps teams rely on most — and which ones they don’t
- Break down activities by category to understand how much time goes toward tasks that truly drive results
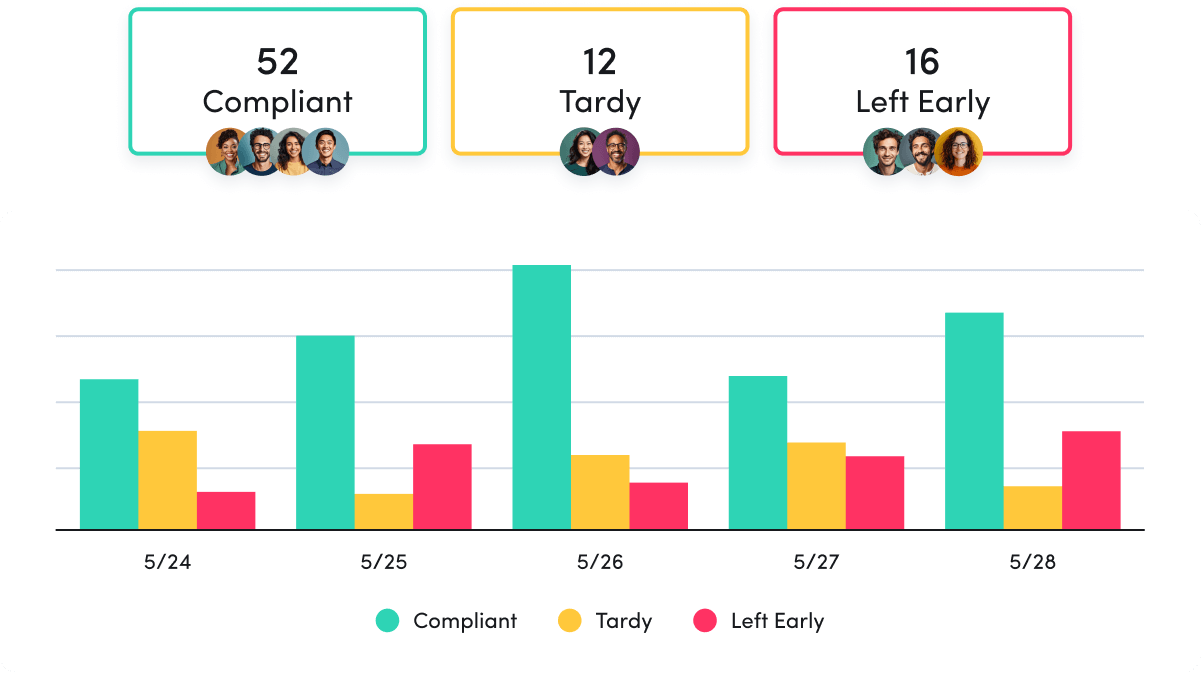
SCHEDULE ADHERENCE
Time tracking to keep teams accountable
- Replace manual time tracking while ensuring data accuracy
- See when employees deviate from assigned schedules
- Leverage real time visibility to improve team coverage and operational efficiency
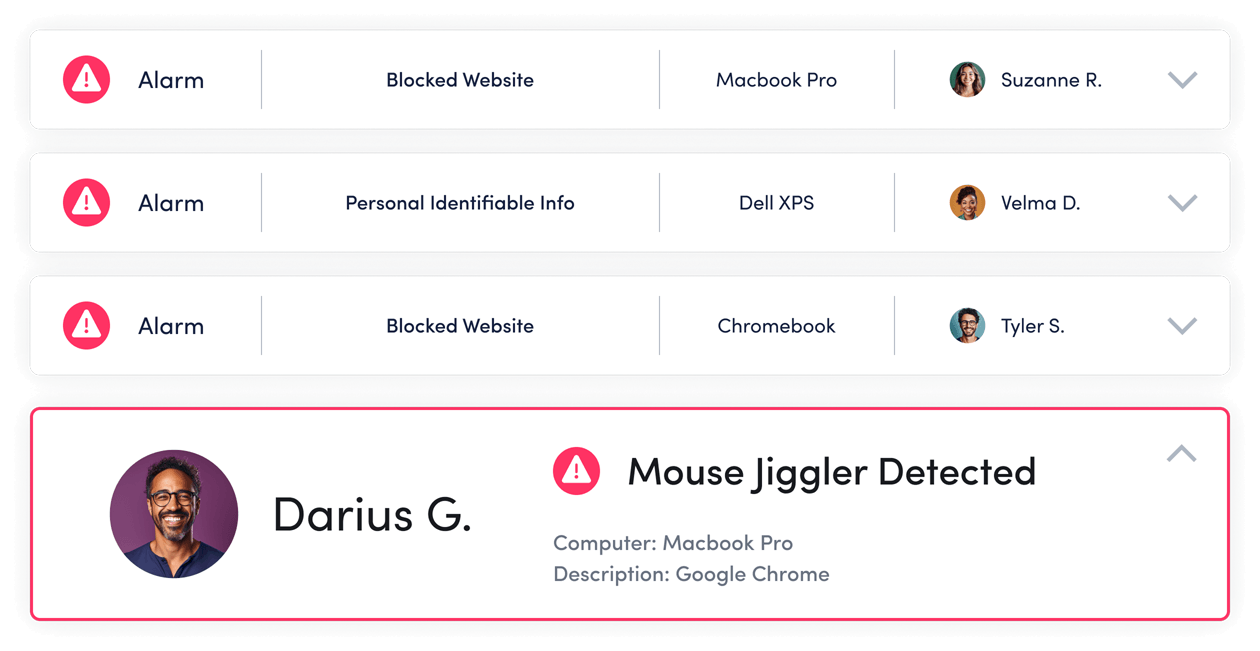
SIGNALS & ALARMS
Catch employee issues as they occur
- Spot attendance gaps before they become problems with real-time alerts
- Get instant notifications of potential mouse jigglers or other false activity
- Easily enforce policies and protect against security risks
NON-DIGITAL ACTIVITY TRACKING
Factor in the offline work of employees
- Integrate with Google Calendar and Outlook to capture in-person meetings and offsite events
- Get a complete picture of each workday, even when people aren’t online
What are ActivTrak’s key features?
ActivTrak is the most comprehensive workforce analytics solution, with robust features to address your employee monitoring, productivity management and workforce planning needs. Make data-driven decisions to quickly optimize performance and boost productivity.
Workforce Management
Remote Workforce Management
Remote Workforce Management
Track employee productivity by work location to guide workplace policy decisions.
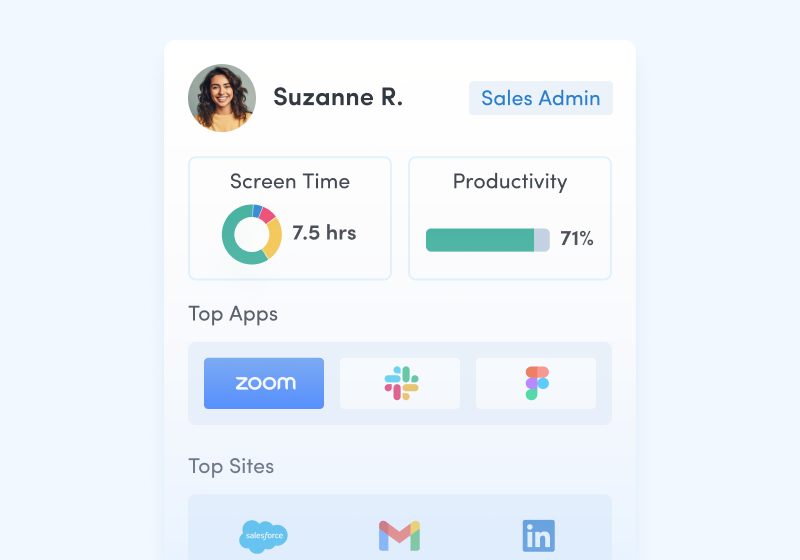
Employee Monitoring
Employee Monitoring
Get real-time visibility into team activity and productivity levels.
Schedule & Policy Adherence
Schedule & Policy Adherence
Monitor late starts, early departures and extended breaks in real time.
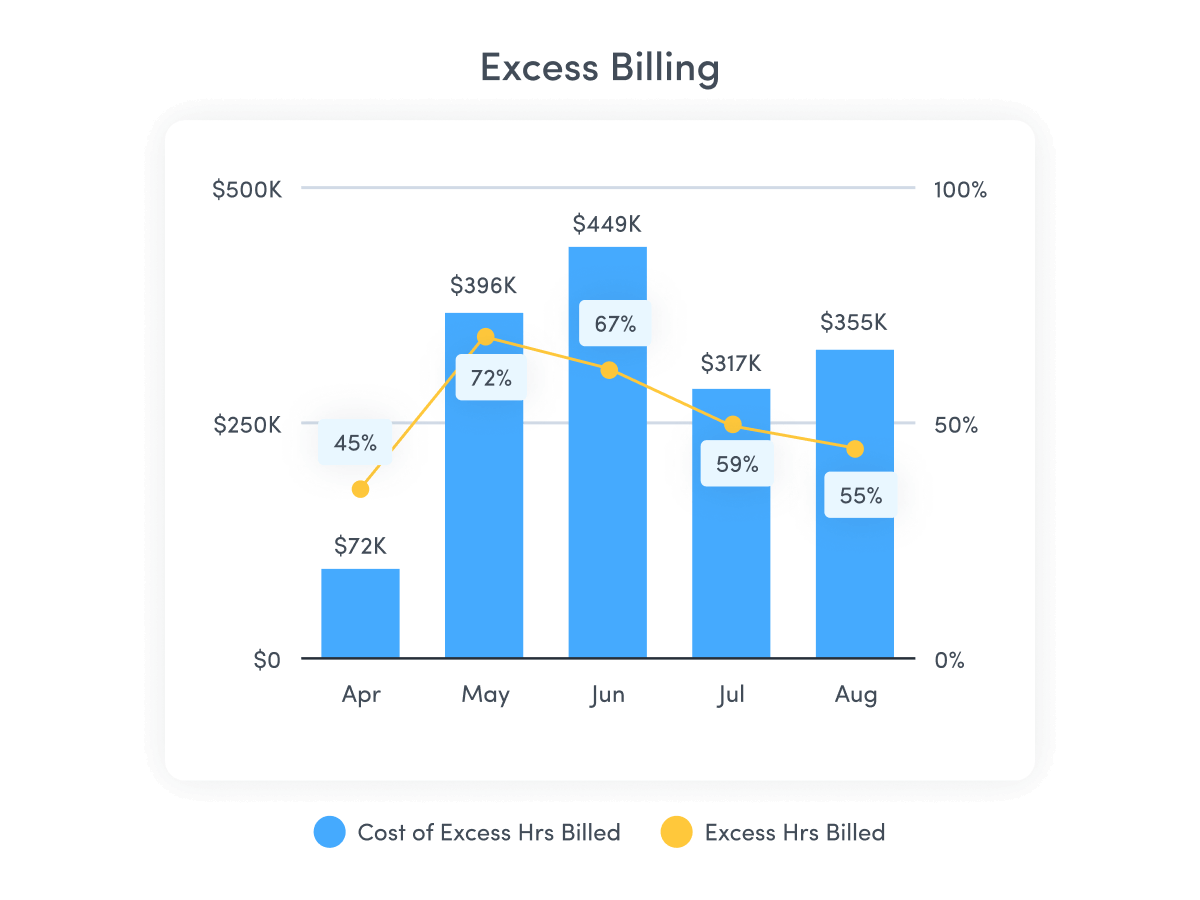
Contractor Billing Reconciliation
Contractor Billing Reconciliation
Confirm contractor hours billed match hours worked.
Timesheet Reconciliation
Timesheet Reconciliation
Automatically verify reported hours against actual work activity to catch errors and prevent overpayments.
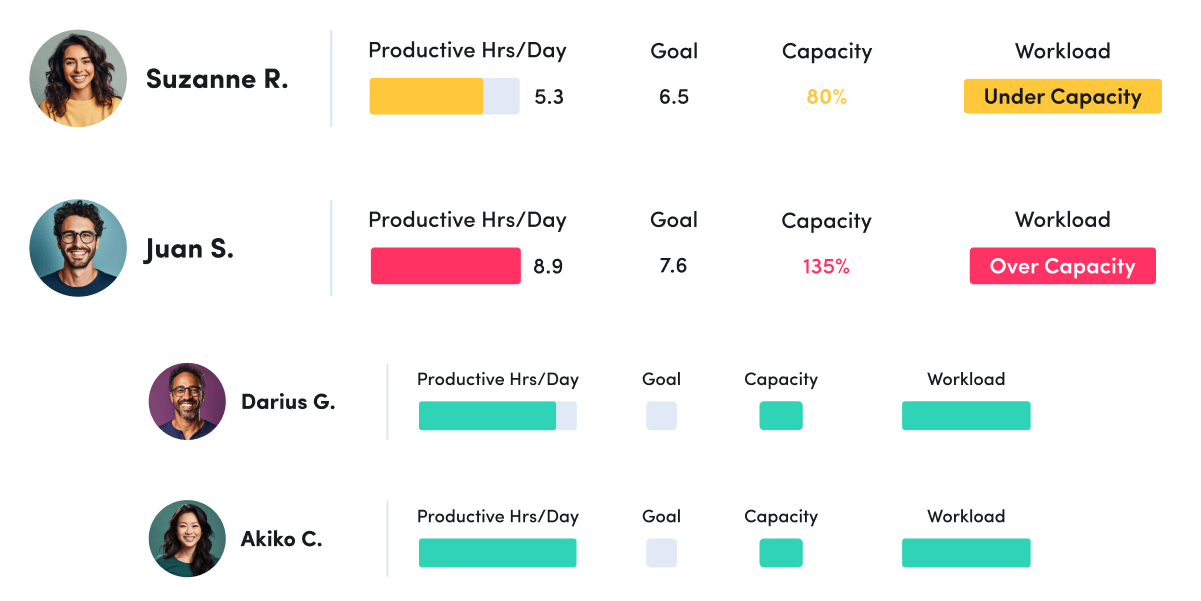
Productivity Optimization
Productivity Management
Productivity Management
Make data-driven decisions to fuel productivity across teams and individuals.
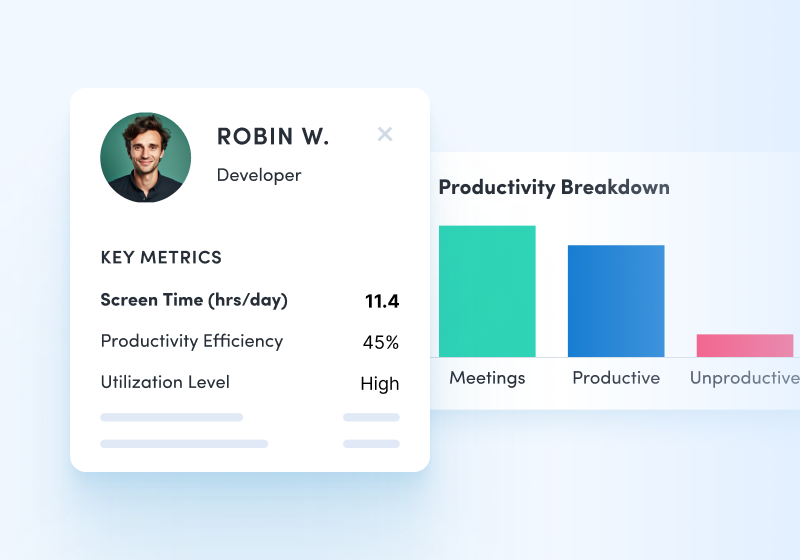
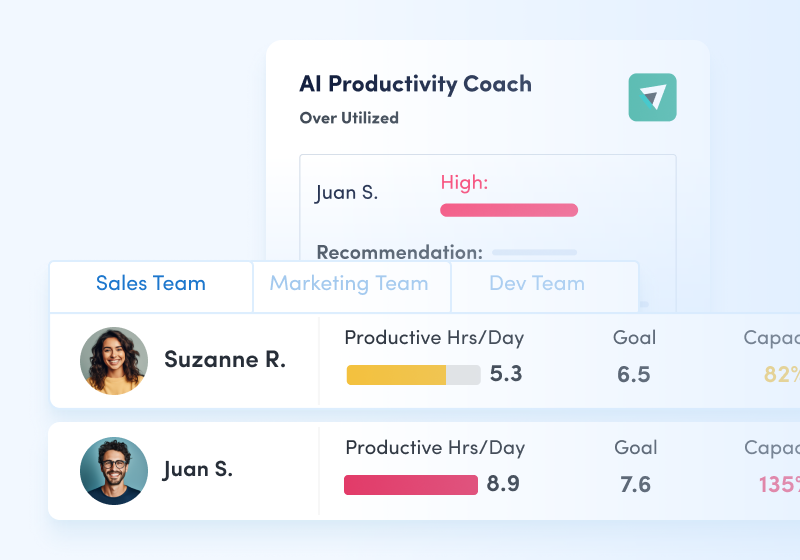
Performance Optimization & Coaching
Performance Optimization & Coaching
Leverage AI-powered insights to understand and optimize team performance.
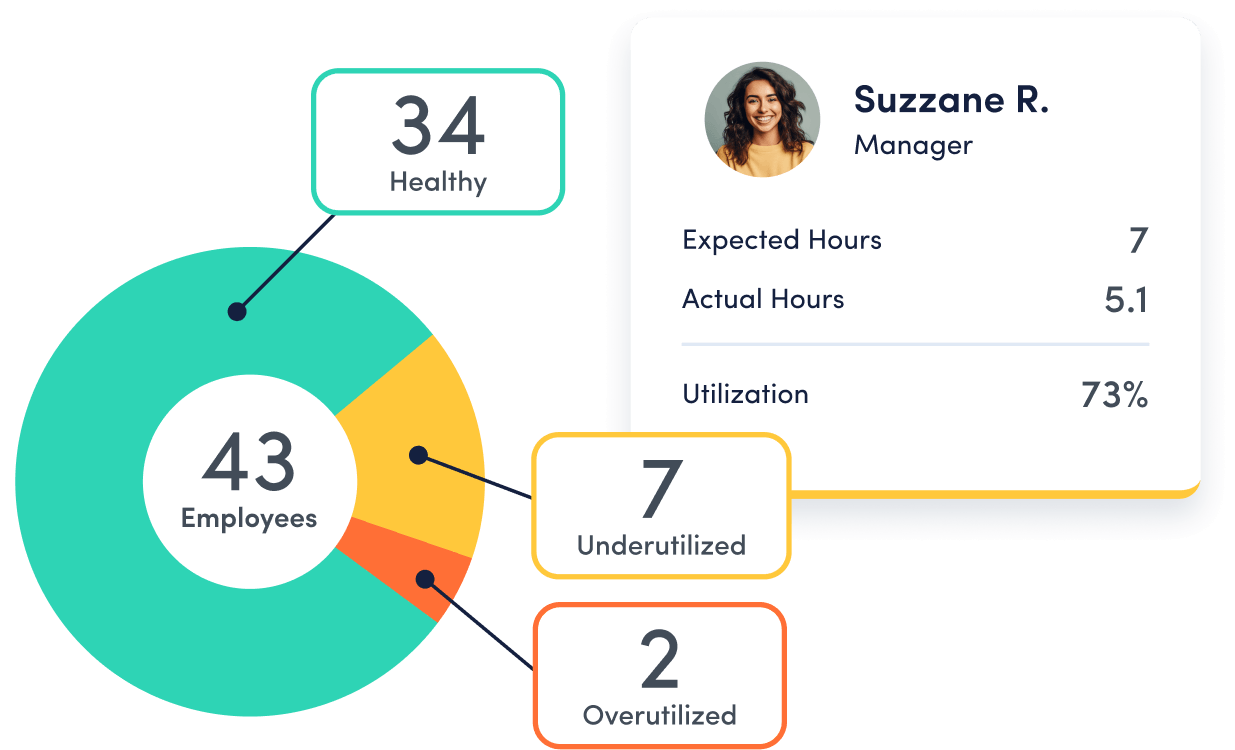
Employee Engagement & Burnout
Employee Engagement & Burnout
Assess employee utilization to detect burnout and balance workloads.
Workforce Planning
Workforce Optimization & Cost Savings
Workforce Optimization & Cost Savings
Uncover hidden inefficiencies to cut costs and boost profitability.
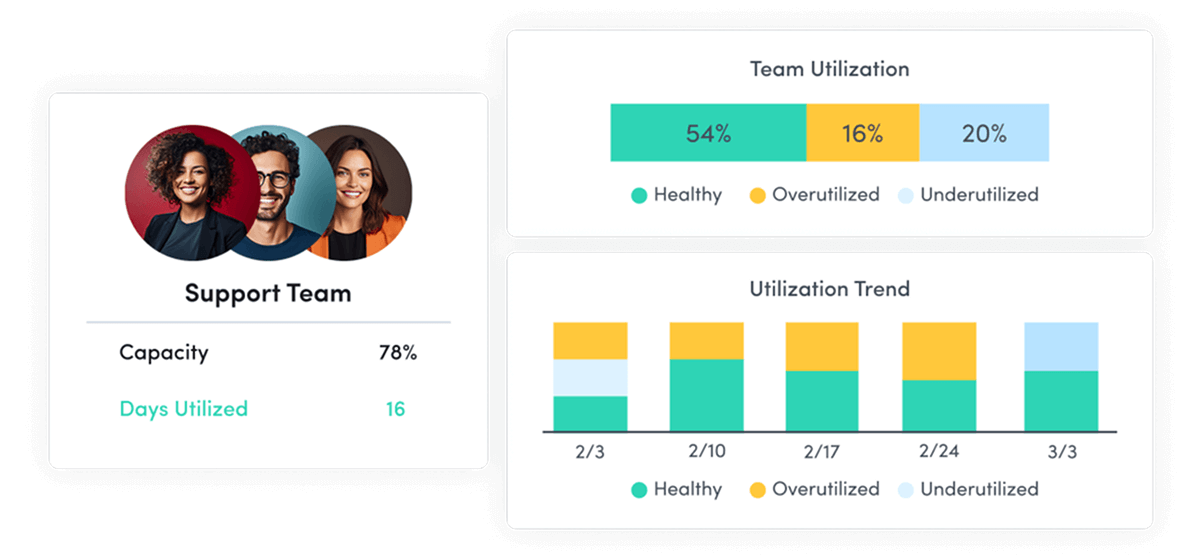
Capacity & Headcount Planning
Capacity & Headcount Planning
Analyze workload capacity to allocate resources and identify staffing needs.
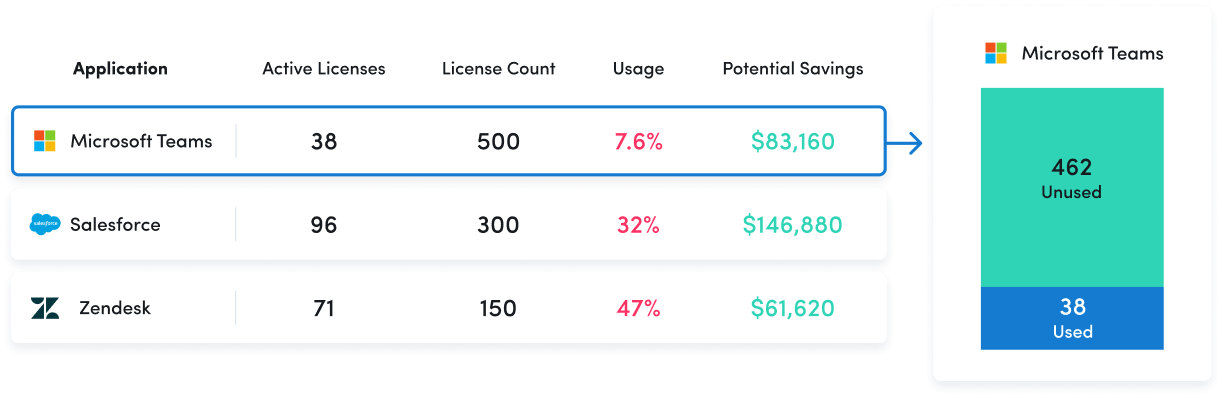
Technology Optimization
Technology Optimization
Track technology usage to identify unused licenses and cut unnecessary costs.
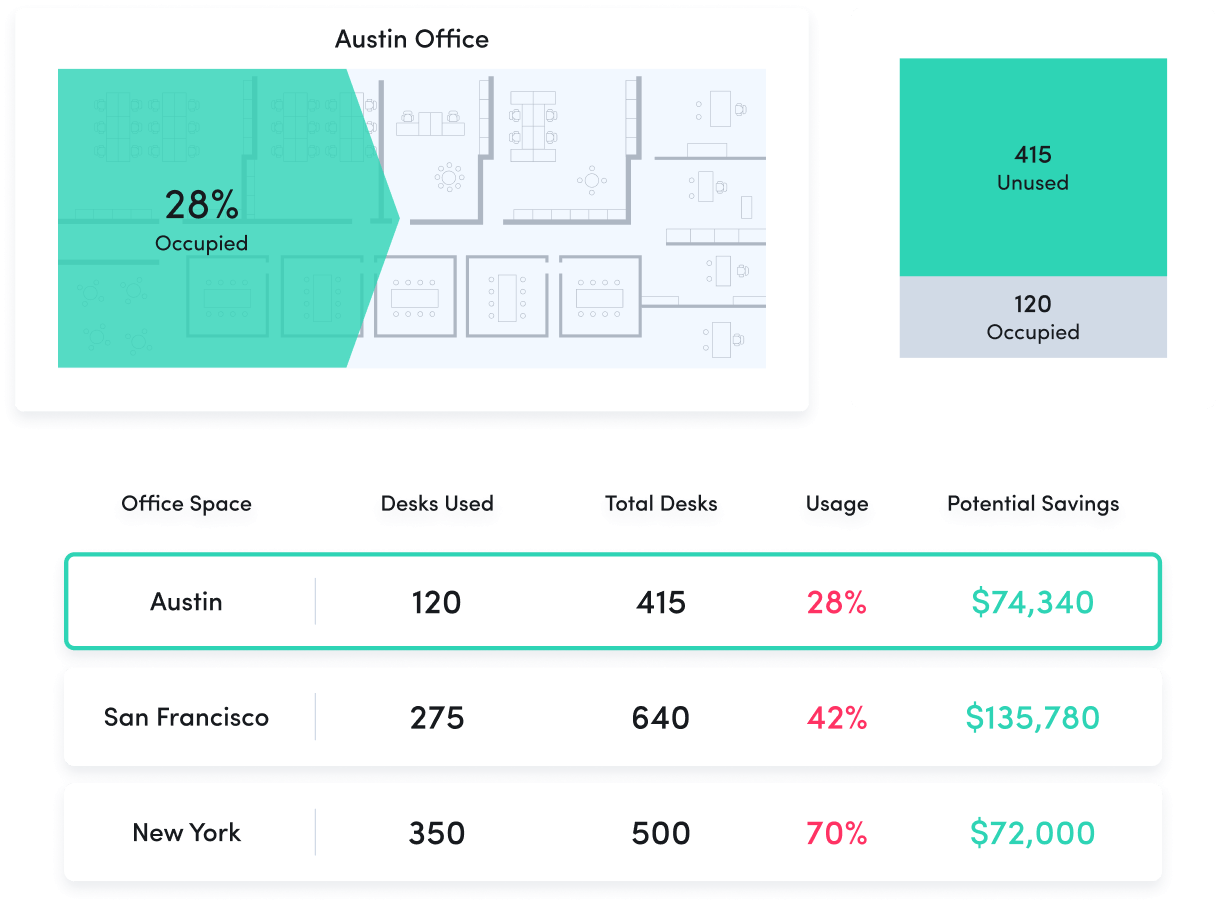
Office Space Planning
Office Space Planning
Right-size real estate investments with insight into office space utilization.
Remote Workforce Management
Track employee productivity by work location to guide workplace policy decisions.
Employee Monitoring
Get real-time visibility into team activity and productivity levels.
Schedule & Policy Adherence
Monitor late starts, early departures and extended breaks in real time.
Contractor Billing Reconciliation
Confirm contractor hours billed match hours worked.
Timesheet Reconciliation
Automatically verify reported hours against actual work activity to catch errors and prevent overpayments.
Productivity Management
Make data-driven decisions to fuel productivity across teams and individuals.
Performance Optimization & Coaching
Leverage AI-powered insights to understand and optimize team performance.
Employee Engagement & Burnout
Assess employee utilization to detect burnout and balance workloads.
Workforce Optimization & Cost Savings
Uncover hidden inefficiencies to cut costs and boost profitability.
Capacity & Headcount Planning
Analyze workload capacity to allocate resources and identify staffing needs.
Technology Optimization
Track technology usage to identify unused licenses and cut unnecessary costs.
Office Space Planning
Right-size real estate investments with insight into office space utilization.
ActivTrak fits your stack
Get deeper insights, integrate with any app.
Saleforce

Microsoft Teams
Slack
ServiceNow
Zendesk
Zoom
Microsoft Viva
Lattice
Qualtrics XM
Jira Software
Workday
ADP
Culture Amp
Asana
How it works
Capture employee activity
Capture employee activity including hours worked, schedule adherence, location policy compliance and app & website usage.
Analyze productivity trends
Analyze productivity trends on employee focus, engagement and utilization to make data-informed decisions on resource allocation.
Optimize team performance
Optimize team performance with benchmarks, goal-tracking and AI coaching recommendations to improve workforce productivity.
See what customers say about ActivTrak
Powered by![]()
Get started with ActivTrak in minutes
FAQs about remote workforce management
What is remote workforce management?
What is remote workforce management?
Remote workforce management is the process of managing remote and hybrid employees. This generally includes a combination of communication, software and processes developed specifically for distributed teams.
At a minimum, these components should make it easy for employees to work from home — and across different time zones — while remaining highly productive. Managing a remote workforce often requires a flexible approach to accommodate flexible schedules, and involves the tricky balance of maintaining oversight without becoming overbearing.
Why is remote workforce management important?
Why is remote workforce management important?
Remote workforce management is essential for businesses that want to implement or expand their remote work policy. A well-rounded strategy provides managers with insights about remote employees so they can provide more relevant support, resulting in better performance for the business.
It also allows you to identify any employees who may be feeling disconnected from the team or even burned out, which can result in communication issues and turnover. By using remote workforce software, managers proactively address these issues by watching for signs before they become larger problems.
What are the benefits of remote workforce management software?
What are the benefits of remote workforce management software?
Using software to manage your remote employees can shed light on how your workplace policies are affecting your workforce. Other benefits of remote workforce management software include:
- Increase productivity and performance
- Reduce burnout and attrition
- Improve work-life balance
- Boost employee engagement
- Recruit from a larger talent pool
- Strengthen communication between managers and employees
- Inform hiring and workload decisions
- Identify and prevent off-site compliance issues
Remote team management software benefits both managers and employees. By gaining visibility for remote workers, managers are better equipped to provide coaching and encourage breaks if an employee starts to show signs of burnout. Remote team management software also helps identify inefficient workflows so managers can update processes and employees can work smarter instead of harder.
What are the challenges of remote workforce management?
What are the challenges of remote workforce management?
While proper oversight provides numerous benefits, it’s not without its difficulties. Common challenges of managing a remote workforce include:
- Communication issues: Most conversations must be planned in advance when done virtually. And unfortunately, video calls and virtual collaboration tools can’t replace the nonverbal cues of face-to-face interactions
- Lack of transparency: While trust is crucial to successful remote work environments, you simply can’t see what employees are up to when you’re not in the same physical workspace.
- Data security: From unsecure coffee Wi-Fi networks to the potential for a stolen laptop, remote workforce management involves risks that don’t factor in at the office.
- Availability differences: Whether it’s project management or team meetings, most remote managers struggle at some point to coordinate schedules. This is especially true for teams distributed across multiple time zones.
The best way to overcome these and other common challenges is with the right tools and practices. Remote workforces come with their own set of difficulties, which means leaders must take a remote-first approach to management.
How do you manage a remote workforce?
How do you manage a remote workforce?
Remote workforce management strategy starts with setting expectations in the form of a remote policy that clearly outlines schedules and goals. Managers should also set up regular meetings, including one-on-ones with individual employees and team-wide syncs where people can share updates and discuss questions or concerns.
It’s also important to ensure team members have the right technology for remote working, from video conferencing and communication tools to reliable remote workforce management software. The latter makes it easy to collect and analyze remote worker activity, allowing you to see when employees may need more support.
Should you purchase remote workforce management software?
Should you purchase remote workforce management software?
Remote workforce solutions are becoming increasingly essential as companies adopt hybrid and remote work policies. Remote team management software helps you understand how employees work, even when people are distributed across different locations and time zones. By using the software, you can see which team members are thriving and who needs support. You’ll also gain insights about what helps people do their best work, so you can adapt policies to maximize productivity.
Even if you only have a small remote team, investing in remote workforce management software sooner rather than later pays off. Consider it from a logistics perspective: Managing a small team of remote employees is difficult. But it becomes even more challenging as your remote workforce grows. By adopting remote workforce management software now, you can establish its place in your technology stack and then scale as your remote workforce grows — and reduce your risk of burnout and turnover from day one.
Our workforce management software also provides insight for hybrid employees and on-site employees, in case you ever change your remote work policy or if workers move closer to your office and want to start coming in.
How can you choose the best remote workforce management software for your business?
How can you choose the best remote workforce management software for your business?
Once you’ve made the decision to invest in a solution, the next step is to narrow down your software options. When comparing remote workforce management solutions, be sure to consider:
- Functionality: Identify the essential features for your remote teams, such as location insights and app usage. Choose a solution that has everything you need, with bonus points for extras.
- Scalability: Look at how the solution can scale as your remote team grows, including what it will cost to add employees or entire departments.
- Integration: Make sure the solution you’re considering integrates with your existing technology stack.
- Customization: Pick something you can customize based on the unique needs and preferences of your business.
- Usability: Get a demo to verify the software is easy to use, especially if there are features employees can use to track their own performance.
- Cost: Look at pricing for each solution to ensure it will fit within your budget as your hybrid or remote workforce grows.
- Customer support: Ensure the solution you choose offers customer support that’s helpful, responsive and fast.
Considering these factors will give you the information you need to choose the right remote workforce management software for your business.
What is ActivTrak’s approach to remote workforce management?
What is ActivTrak’s approach to remote workforce management?
If you want to manage your remote workforce productively, you’ll first need to collect data and establish a baseline for measuring improvement. This is exactly what ActivTrak is designed to do.
Our remote work management software continually monitors metrics such as work duration and app usage, with finely-tuned privacy controls that help you build trust with employees. We provide insights that make it easy to see how and when remote employees are most productive, what technology they need and even who’s at risk of overwork and burnout.
And we do it all without the need for trust-busting surveillance or heavy oversight. Our workforce management software provides all the insights you need to support both in-office and remote teams — and none of the details you don’t. Our powerful platform focuses on collecting contextual data while avoiding invasive employee monitoring technologies like keystroke logging and continuous screenshots.
All so you can build a remote work culture of trust and transparency while providing the support people need to do their best work from any location. Request a demo to see it in action today.
How do I choose the right workforce management software?
How do I choose the right workforce management software?
Choosing workforce management software starts with understanding your business goals. Look for a solution like ActivTrak that provides clear productivity insights, supports remote and hybrid work, protects employee privacy and scales as your organization grows.
What are the benefits of workforce management software?
What are the benefits of workforce management software?
Workforce management software helps organizations improve productivity, reduce wasted effort and make smarter staffing decisions. Teams gain better visibility into how work happens, while leaders can align resources to the work that drives results.
How does workforce management software impact business performance?
How does workforce management software impact business performance?
Workforce management software helps leaders connect productivity, capacity and labor investment to real business outcomes. By identifying inefficiencies and underutilized resources, organizations can improve performance without increasing headcount.
What is the difference between workforce management software and remote work software?
What is the difference between workforce management software and remote work software?
Workforce management software focuses on how work is planned, distributed and optimized across teams. Remote work software typically focuses on communication or collaboration. Workforce management connects activity data to business outcomes.
Hybrid and remote workforce management educational resources
Hybrid and remote workforce management educational resources
In addition to information about ActivTrak’s software, we’ve also created several resources about hybrid and remote workforce management to help you make an informed decision when choosing a tool for your organization.
- Workforce management: A complete guide
- How to unlock the benefits of remote work
- 3 key hybrid and remote worker monitoring metrics
- Remote work monitoring done right
- Looking toward the future of remote work
- The impact of remote work on productivity levels
- How to manage remote workers with success
- How to overcome common remote team challenges
- How implementing a remote work policy helps employees work smarter
- Remote workforce technology to maximize productivity