Contractor and vendor billing reconciliation. To reduce overcharges and excess costs.
Trusted by 9,500+ global brands and organizations
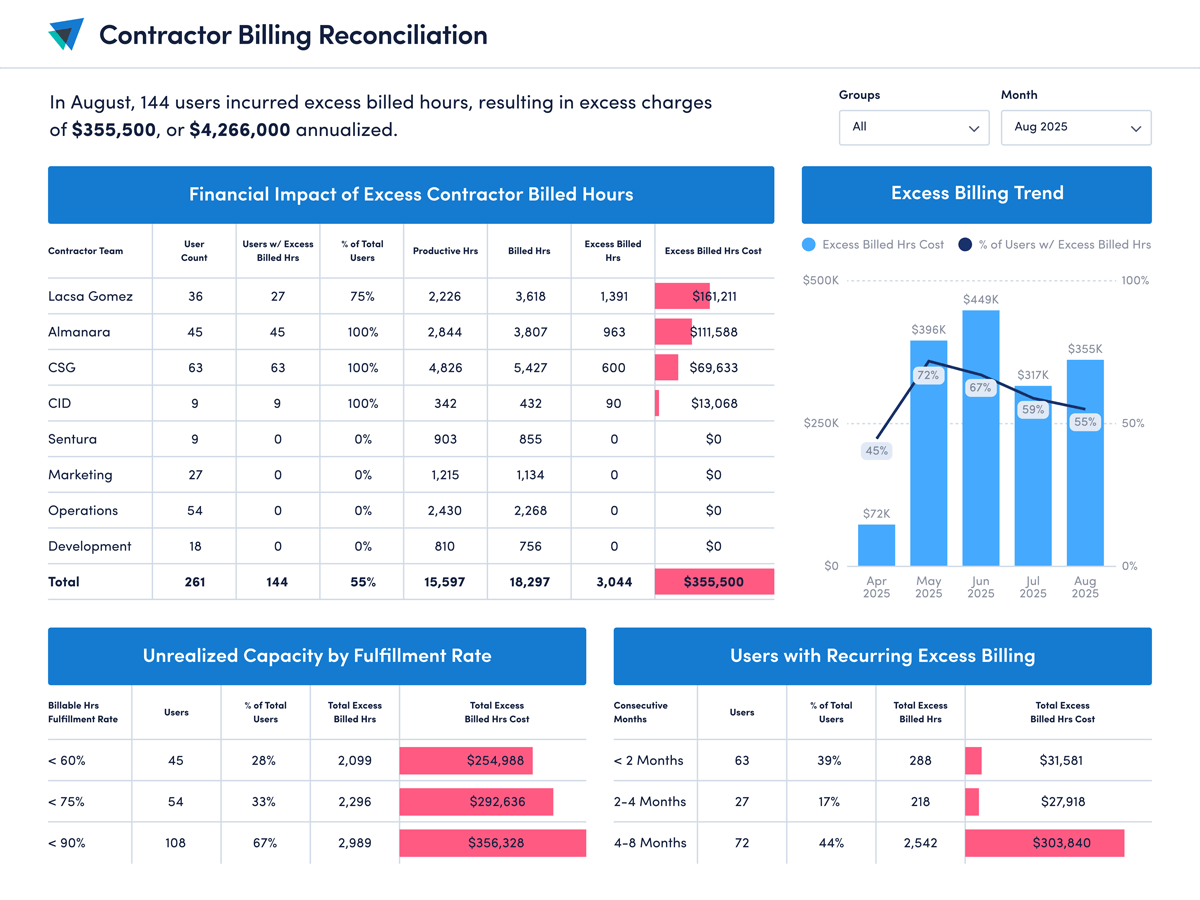
Contractor Billing Reconciliation
Data-driven contractor and vendor management
Verify invoice accuracy automatically. Before overbilling turns into overpaying.

“With ActivTrak, we have found opportunities to improve the level of engagement with remote staff without losing touch. This allows our management team to continue to focus on managing all staff with consistency and monitor application utilization levels.”
– C-Level Executive in IT
Billing Validation
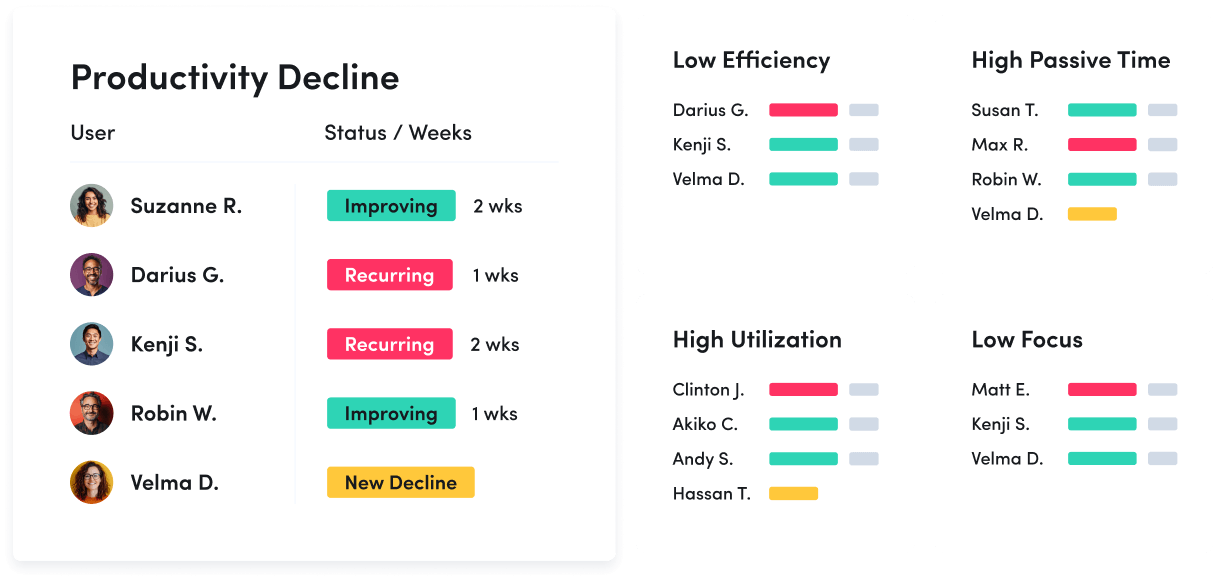
Track productivity against billed hours
- Compare billed hours to productive hours worked
- Automatically identify billing discrepancies and overcharges
- Spot errors and address billing issues as they happen
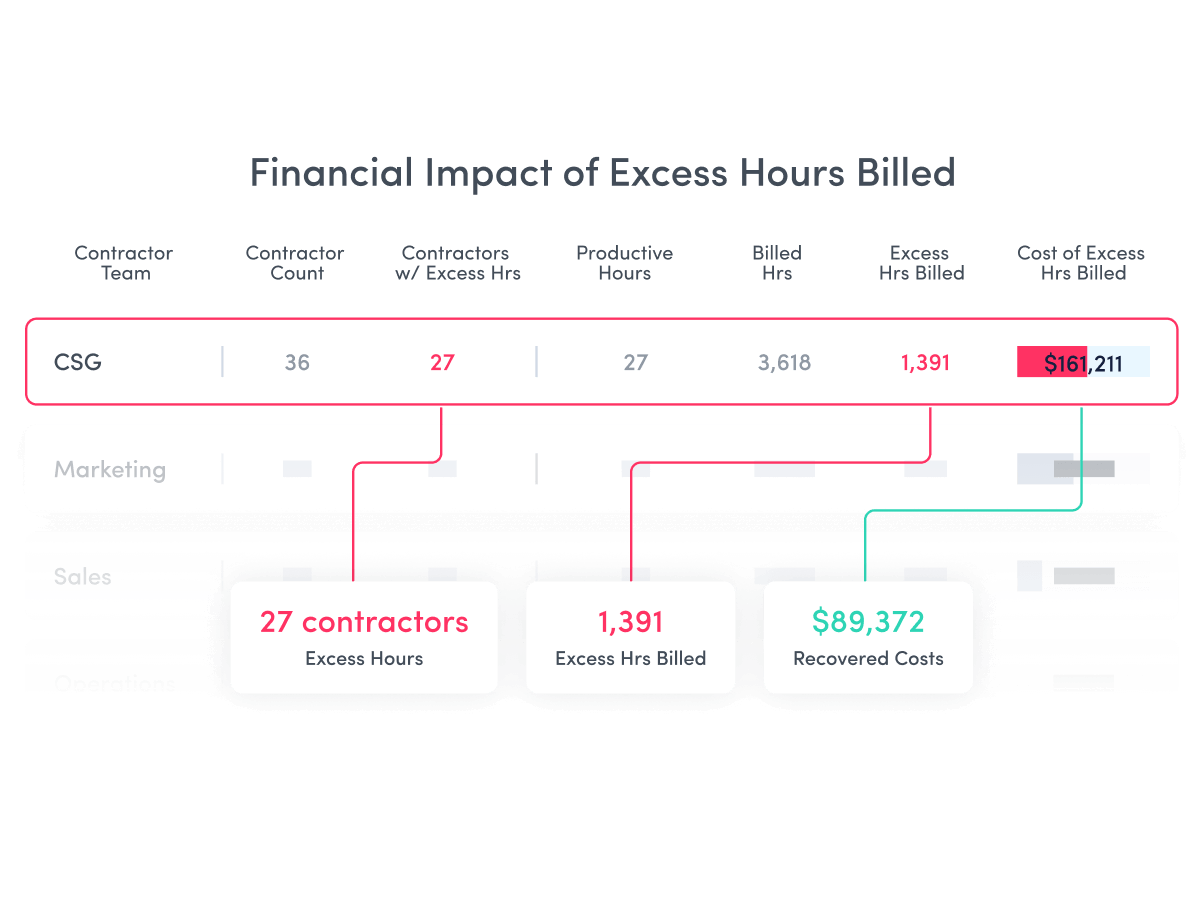
Cost Recovery
Identify up to 30% in unnecessary spend
- Improve accountability by breaking down excess billing by department and team
- Recover overbilled costs with accurate data
- Maintain precise financial records for vendor negotiations, disputes and audits
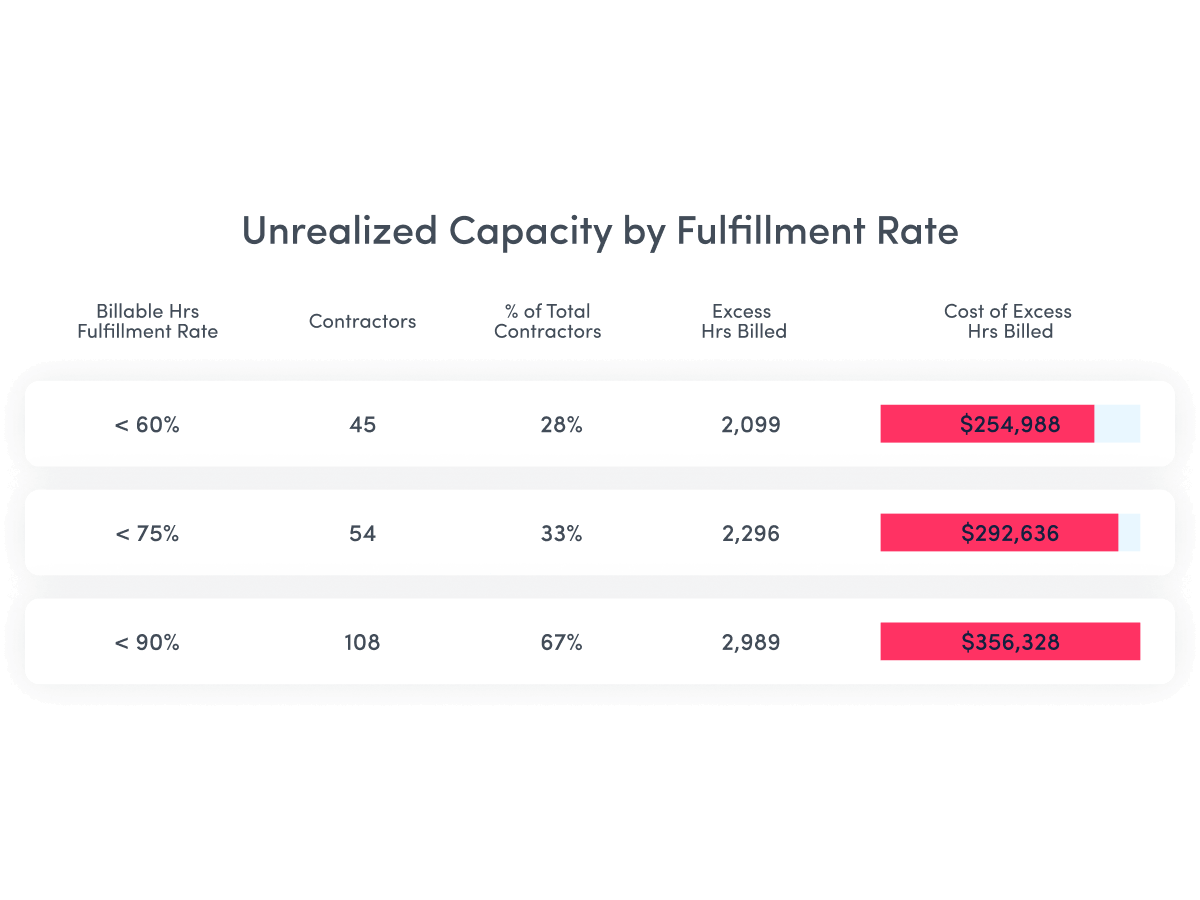
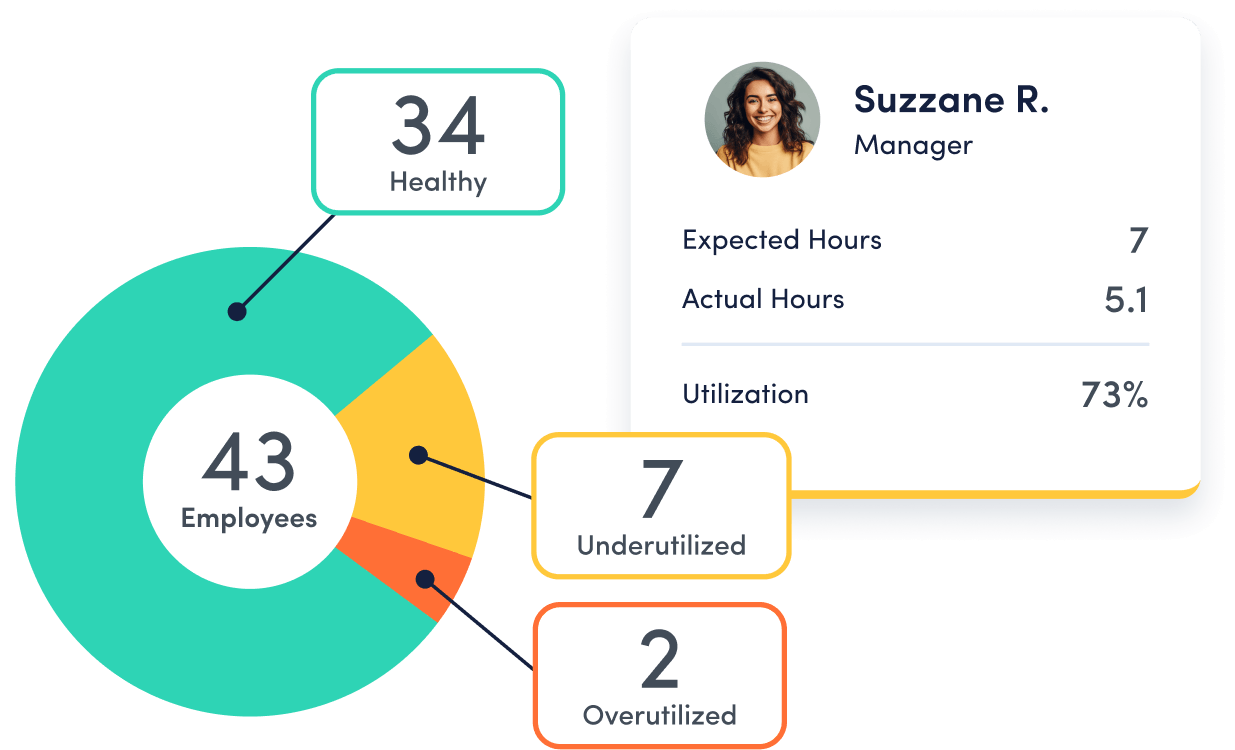
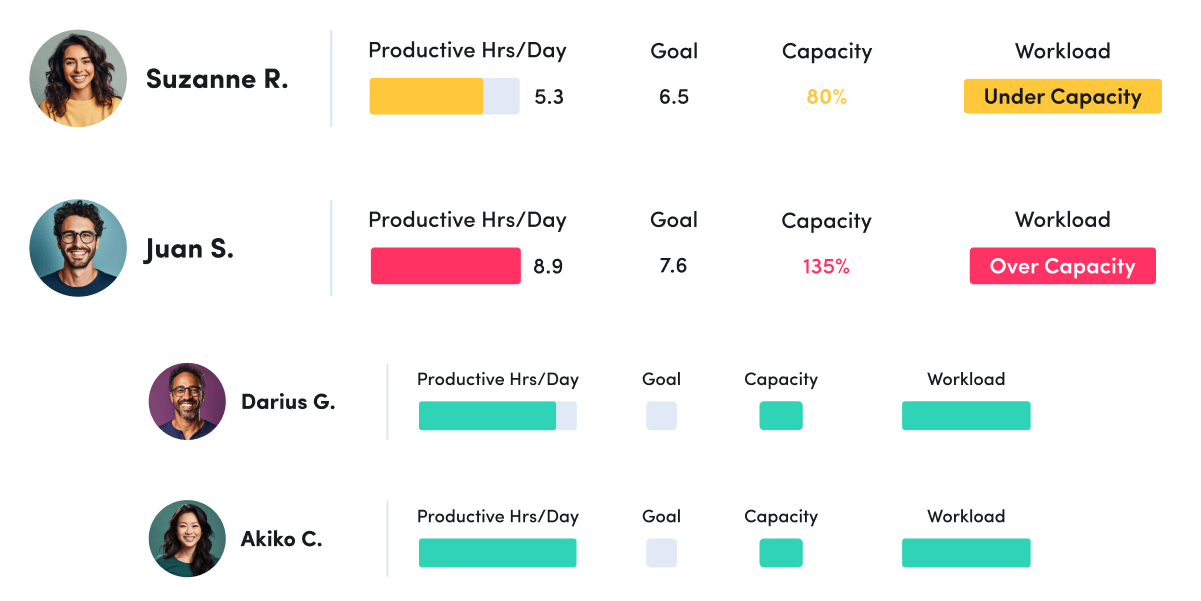
Utilization Optimization
Optimize contractor allocation and spending
- Optimize contractor value with a clear view of unrealized capacity by fulfillment rate
- Verify productive hours to billed hours across contractors, teams and vendors
- Bring activity data to contractor renewals and resource planning
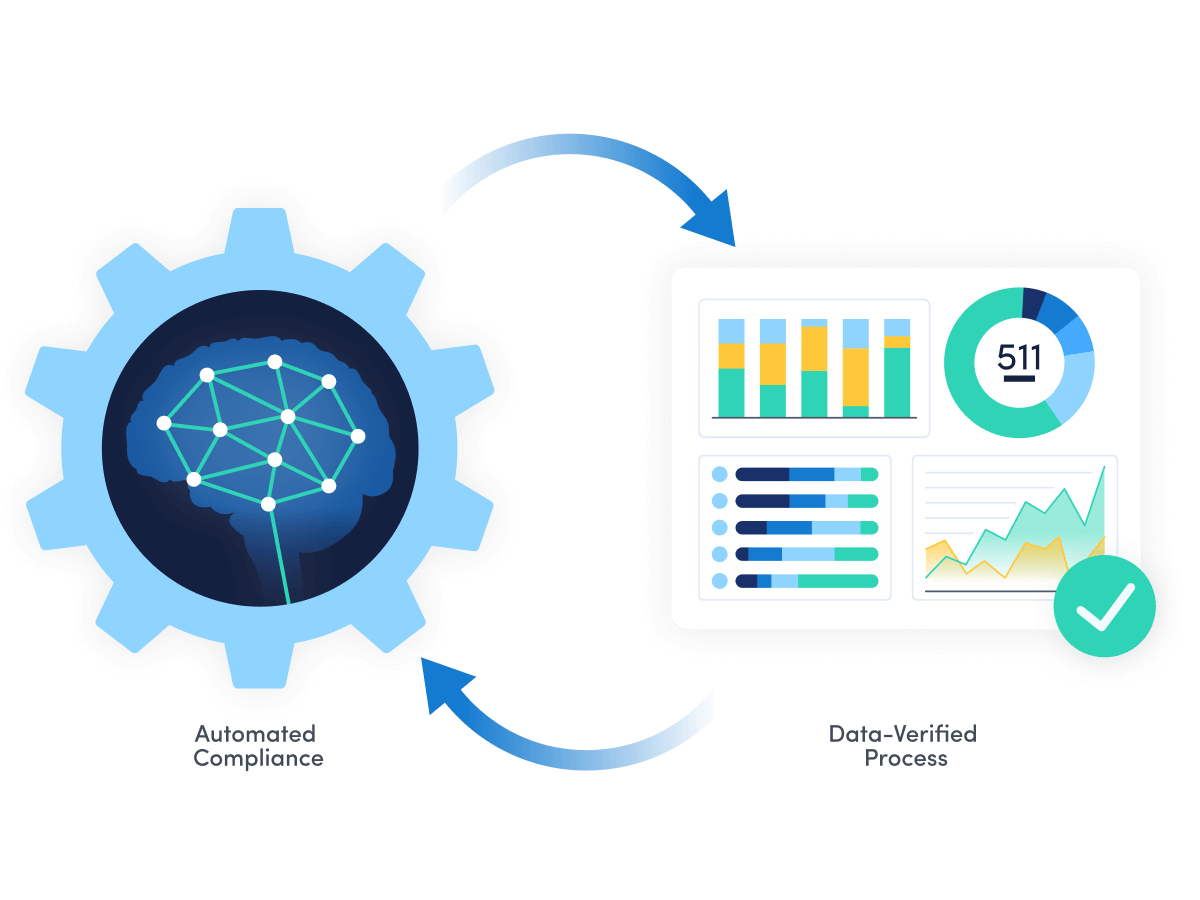
Automated Compliance
Replace manual audits with systematic monitoring
- Replace manual validation with automated reconciliation
- Maintain billing oversight without requiring contractors to adopt separate time tracking systems
Explore our powerful features
ActivTrak is the most comprehensive workforce analytics solution, with robust features to address your employee monitoring, productivity management and workforce planning needs. Make data-driven decisions to quickly optimize performance and boost productivity.
Workforce Management
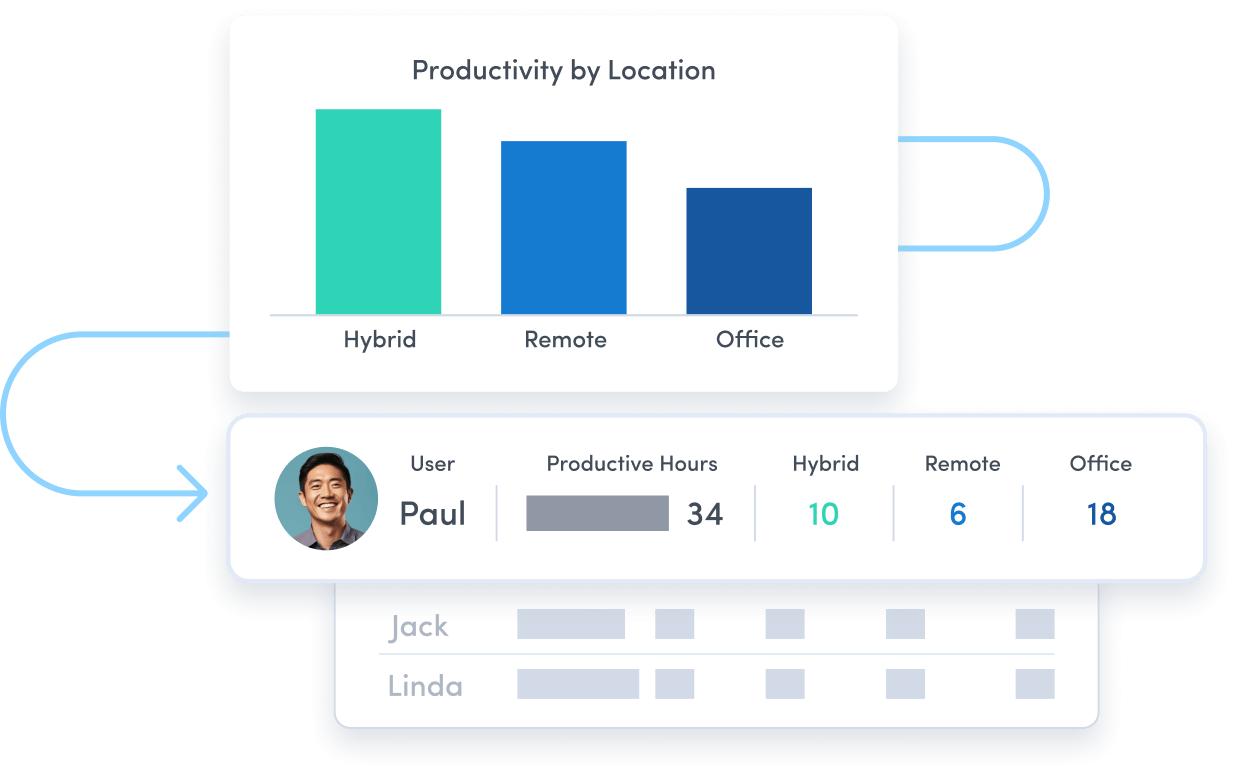
Remote Workforce Management
Remote Workforce Management
Track employee productivity by work location to guide workplace policy decisions.
Employee Monitoring
Employee Monitoring
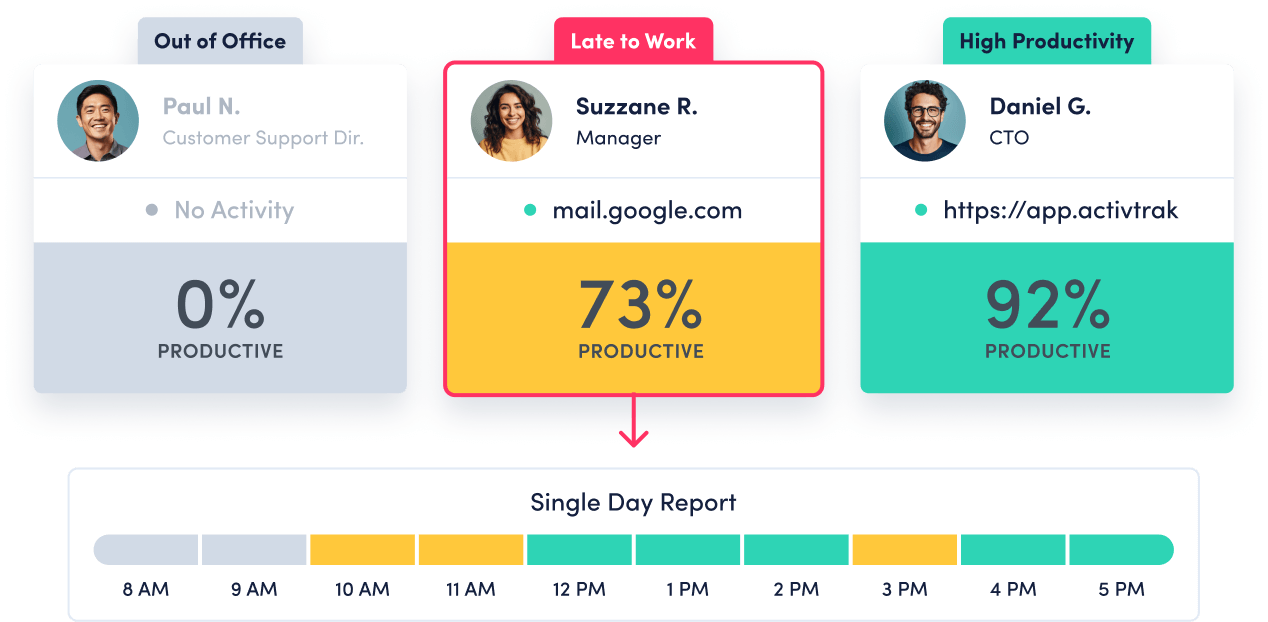
Get real-time visibility into team activity and productivity levels.
Time Tracking & Auditing
Time Tracking & Auditing
Get detailed insight into employee work hours and locations, with time categorized as productive, unproductive or undefined.
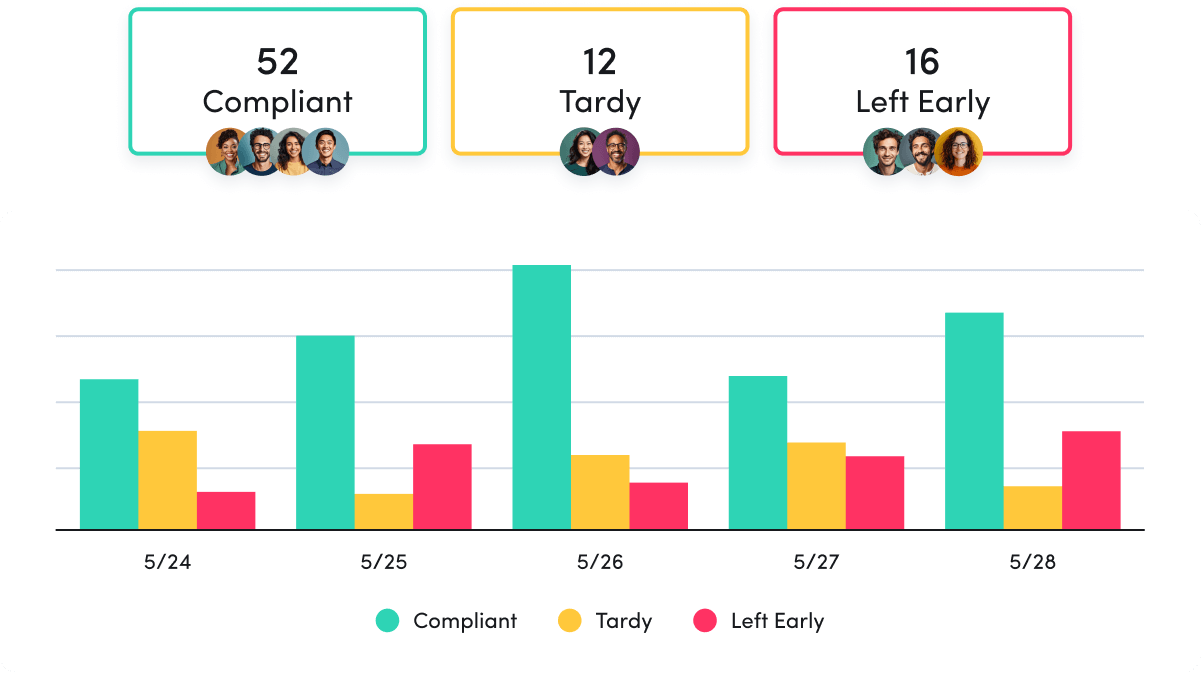
Schedule & Policy Adherence
Schedule & Policy Adherence
Monitor late starts, early departures and extended breaks in real time.
Contractor Billing Reconciliation
Contractor Billing Reconciliation
Confirm contractor hours billed match hours worked.
Productivity Optimization
Productivity Management
Productivity Management
Make data-driven decisions to fuel productivity across teams and individuals.

Performance Optimization & Coaching
Performance Optimization & Coaching
Leverage AI-powered insights to understand and optimize team performance.
Employee Engagement & Burnout
Employee Engagement & Burnout
Assess employee utilization to detect burnout and balance workloads.
Workforce Planning
Workforce Optimization & Cost Savings
Workforce Optimization & Cost Savings
Uncover hidden inefficiences to cut costs and boost profitability.

Capacity & Headcount Planning
Capacity & Headcount Planning
Analyze workload capacity to allocate resources and identify staffing needs.
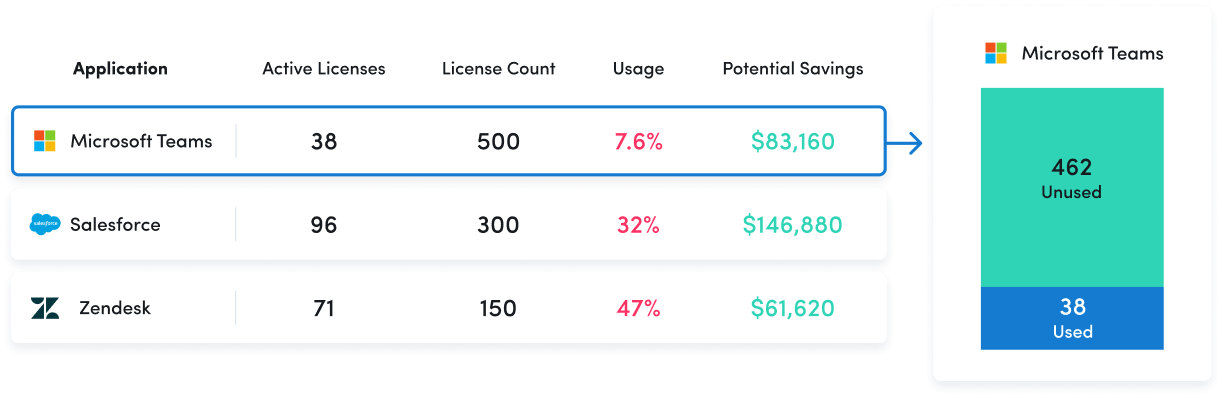
Technology Optimization
Technology Optimization
Track technology usage to identify unused licenses and cut unnecessary costs.
Office Space Planning
Office Space Planning
Right-size real estate investments with insight into office space utilization.
Remote Workforce Management
Track employee productivity by work location to guide workplace policy decisions.
Employee Monitoring
Get real-time visibility into team activity and productivity levels.
Time Tracking & Auditing
Get detailed insight into employee work hours and locations, with time categorized as productive, unproductive or undefined.
Schedule & Policy Adherence
Monitor late starts, early departures and extended breaks in real time.
Contractor Billing Reconciliation
Confirm contractor hours billed match hours worked.
Productivity Management
Make data-driven decisions to fuel productivity across teams and individuals.
Performance Optimization & Coaching
Leverage AI-powered insights to understand and optimize team performance.
Employee Engagement & Burnout
Assess employee utilization to detect burnout and balance workloads.
Workforce Optimization & Cost Savings
Uncover hidden inefficiences to cut costs and boost profitability.
Capacity & Headcount Planning
Analyze workload capacity to allocate resources and identify staffing needs.
Technology Optimization
Track technology usage to identify unused licenses and cut unnecessary costs.
Office Space Planning
Right-size real estate investments with insight into office space utilization.
ActivTrak fits your stack
Get deeper insights, integrate with any app.
Saleforce

Microsoft Teams
Slack
ServiceNow
Zendesk
Zoom
Microsoft Viva
Lattice
Qualtrics XM
Jira Software
Workday
ADP
Culture Amp
Asana
How it works

Collect
Use the ActivTrak Agent to gather digital activity data about how employees work while safeguarding employee privacy.

Analyze
Assess productivity drivers, engagement levels and work habits through intuitive dashboards and AI-powered reports.

Optimize
Use ActivTrak Coach to improve productivity, performance and resource utilization for organizational health and well-being.
See what customers say about ActivTrak
Powered by![]()
FAQs about contractor billing reconciliation
What is contractor and vendor statement reconciliation?
Contractor billing reconciliation is the vendor reconciliation process of validating contractor invoices against actual work performed. This includes comparing billed hours to productive hours worked, identifying discrepancies and ensuring contract terms are met. Organizations with significant contractor spend often face challenges validating billing accuracy as manual processes are time-consuming and prone to data entry errors. Traditional approaches also lack the ability to detect duplicate payments or maintain accurate financial records across multiple vendors. An analytics-based approach provides automated reconciliation, reducing human error while ensuring accurate and up-to-date records.
Why is contractor and vendor statement reconciliation important?
Organizations lose up to 30% in contractor spend due to overbilling, billing errors and duplicate payments. Without an efficient validation method, companies lack visibility into billing accuracy and have no data to dispute overcharges or maintain accurate financial records. Manual processes are time-consuming and prone to data entry errors that can impact cash flows. Contractor billing reconciliation transforms billing from a trust-based system into a data-verified process, enabling finance and operations leaders to identify problems, recover costs and ensure timely, accurate payments. This results in significant cost savings and improved vendor accountability.
What are the benefits of contractor and vendor statement reconciliation software?
Using an automated workforce analytics tool to reconcile contractor billing provides visibility that manual processes cannot match. Benefits include identifying and recovering overbilled amounts with concrete data evidence, automating validation processes that are time-consuming and prone to data entry errors, seeing patterns and trends across teams and vendors, ensuring contract compliance through systematic monitoring, reducing human error in validation and maintaining accurate financial records. This automation eliminates manual processes that typically take days while ensuring accurate payment and helping organizations better manage outstanding invoices and balance tracking. Organizations with 100+ contractors and $5M+ annual contractor spend can identify and recover substantial excess costs while improving cash flows.
What are the challenges of contractor and vendor statement validation?
Common challenges include no visibility into billing accuracy, time-consuming manual validation , data entry errors leading to duplicate payments or processing errors, lack of data to dispute overcharges, no systematic compliance checking and difficulty maintaining accurate financial records across multiple vendors. Traditional approaches require reconciling vendor invoices against internal records manually, which creates bottlenecks and increases the risk of errors. Many organizations struggle to track outstanding invoices and balances across their accounts payable ledger efficiently. Without an automated workforce analytics tool, finance teams spend significant time on manual processes that could be streamlined, ultimately accepting billing errors and potential issues as the cost of doing business.
What is ActivTrak’s approach to contractor and vendor billing reconciliation?
ActivTrak provides analytics-based reconciliation that compares billed hours to productive hours worked without requiring contractors to change their billing workflows. Our solution uses passive monitoring through the ActivTrak Agent to capture productive work, which is then compared against billing data imported via Google Sheets. Pre-built BI templates for PowerBI, Tableau and Looker provide instant visibility into excess billing, utilization patterns and financial impact. This automation validates billing accuracy while respecting contractor autonomy and maintaining productivity, replacing time-consuming manual processes with a streamlined vendor reconciliation process that ensures accurate and up-to-date financial records.